The New York Times’ Paul Krugman has a series of charts today that are supposed to show that austerity has failed in Britain. The charts show that economic growth in the country has diverged from what one would expect it to be (because we know how accurate economic forecasts and projections often are). Here is Krugman’s reaction to the charts:
Gee, remember the enthusiasm with which the Cameron/Osborne turn to austerity was greeted by VSPs on both sides of the pond, with David Broder urging Obama to “do a Cameron”?
What Krugman calls the “Cameron/Osborne turn to austerity” is the announcement originally made by Chancellor George Osborne that he would cut £3 in government spending for every £1 in new tax revenue. Interestingly, Krugman doesn’t describe the type of austerity measures that were actually implemented in the U.K., and seems to assume that what was announced is what came to pass. That, however, is an incorrect assumption. When I looked at the data back in June, we saw that of the roughly £40 billion that was shaved from the deficit during the 2010–2011 budget cycle, for every £3 of new tax revenue, U.K. taxpayers got £1 in cuts — exactly the reverse of what was promised.
What’s more, the evidence indicates that U.K. has, at best, slowed down the growth of spending, but it has not engaged in actual spending cuts. I documented the trend in British spending earlier this year:
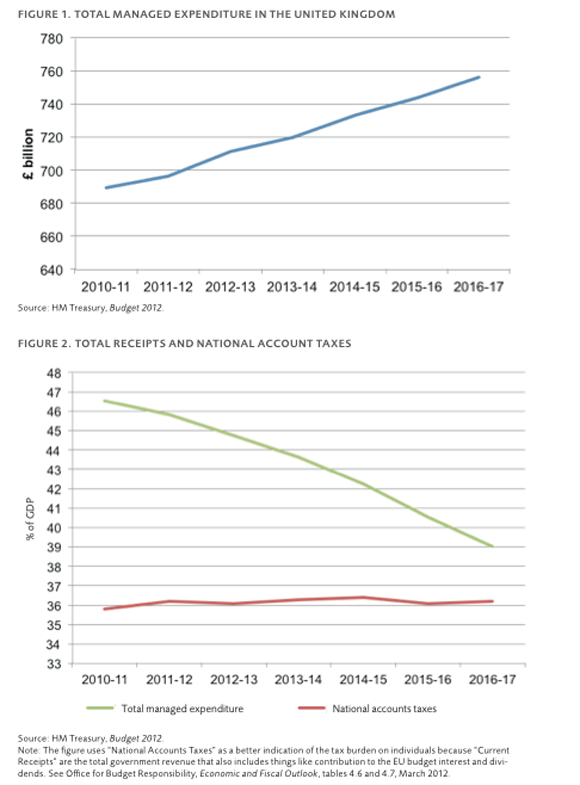
A look at the data in Her Majesty’s Fiscal Year 2012 Budget shows (see table 2.3) that total managed expenditures will increase from £696.4 billion in 2011–2012 to £733.5 billion in 2014–2015, and further to £756.3 billion in 2016–2017.* Adjusted for population growth, this is slow growth, but not a savage cut. That table also shows a “projected” drop in Public Sector Gross Investment between 2012–2013, but if it ever materializes, it will be contained to that year alone.
Spending cuts in the UK can’t be blamed for the weak growth path the country is on. On the other hand, tax increases can. #more#Here is a list:
-
a VAT hike from 17.5 percent to 20 percent (probably the main culprit of the U.K.’s current problems)
-
a new 50 percent tax bracket on incomes over £150,000, which will drop to 45 percent next year
-
an increase in air-passenger duty to 8 percent
-
“temporary” payroll tax of 50 percent on bonuses over £25,000
-
a capital-gains tax hike
-
a 0.088 percent levy on banks
-
an increase to 7 percent in the stamp duty on the sale of properties worth more than £2 million and on properties bought through “non-natural persons.”
(For more, go here.) The bottom line is that the U.K. is another case of private-sector austerity (i.e., tax hikes) without public-sector austerity (i.e., spending cuts). Keynesian economists should be upset since they are, in theory, opposed to tax increases during weak economic times, but you wouldn’t necessarily know it since their main complaint about European austerity has been that spending cuts have been too drastic.
To learn more about austerity in the U.K., please check out this new and very good paper, ”In Search of Austerity: An Analysis of the British Situation,” by British economist Anthony Evans. The paper makes the following points, among others:
-
The British government’s response to the recession has been to eliminate the structural budget deficit over the medium term.
-
There have been changes in the composition of government spending but not a reduction in the absolute level.
-
Forecasts of falling government spending as a proportion of GDP are due to implausible growth forecasts rather than an absolute reduction in spending.
-
History indicates that the government overestimates its ability to fund austerity through spending cuts, and therefore greater-than-expected tax increases are likely.
Evans also asks this question: if in fact, spending cuts have not been implemented as advertised, why would the British government continue to claim it has engaged in such an unpopular policy? Evans’s answer:
There are two main political reasons for this. The first is because the government has identified the problems in Greece and other European countries as a warning,and the priority of its economic policy is to avoid slipping into a sovereign debt crisis. The government has attempted to reassure the bond markets that the debt burden is under control and that sensible government finances are a priority. British households are over leveraged and high interest rates would cause significant pain.The government has staked its reputation on low interest rates, and having a credible deficit-reduction plan to calm the markets is a central platform. Second, the government has inherited an expensive public sector. It helps wage nhttps://www.nationalreview.com/node/331505/editegotiations to reinforce the message that public finances are in dire straits. The planned cuts are unpopular, but genuine cuts would be even more so. In March 2011over 250,000 people protested cuts to public spending; this was the largest protest since the Iraq war.
Update: *After looking again at the table 2.3, I realized that I should write down the budget numbers for total managed expenditures for the years 2012-2013 and the year 2013-2014. The number for 2012-2013 is £683.4 billion (it would be a 1.8 percent reduction over 2011. However, if you read the footnote at the bottom of the table it looks like the reduction is the result of a temporary transfer of funds from and to different government accounts). The number for 2013-2014 is £720 billion followed by £733.5 billion in 2014–2015.
Public Sector Current Expenditure is as follow: 2010-2011: £647.3 billion; 2012-2013: £664.6 billion; 2013-2014 is £673.6 billion followed by £686.4 billion in 2014–2015.
Here is a link to two interesting charts.