
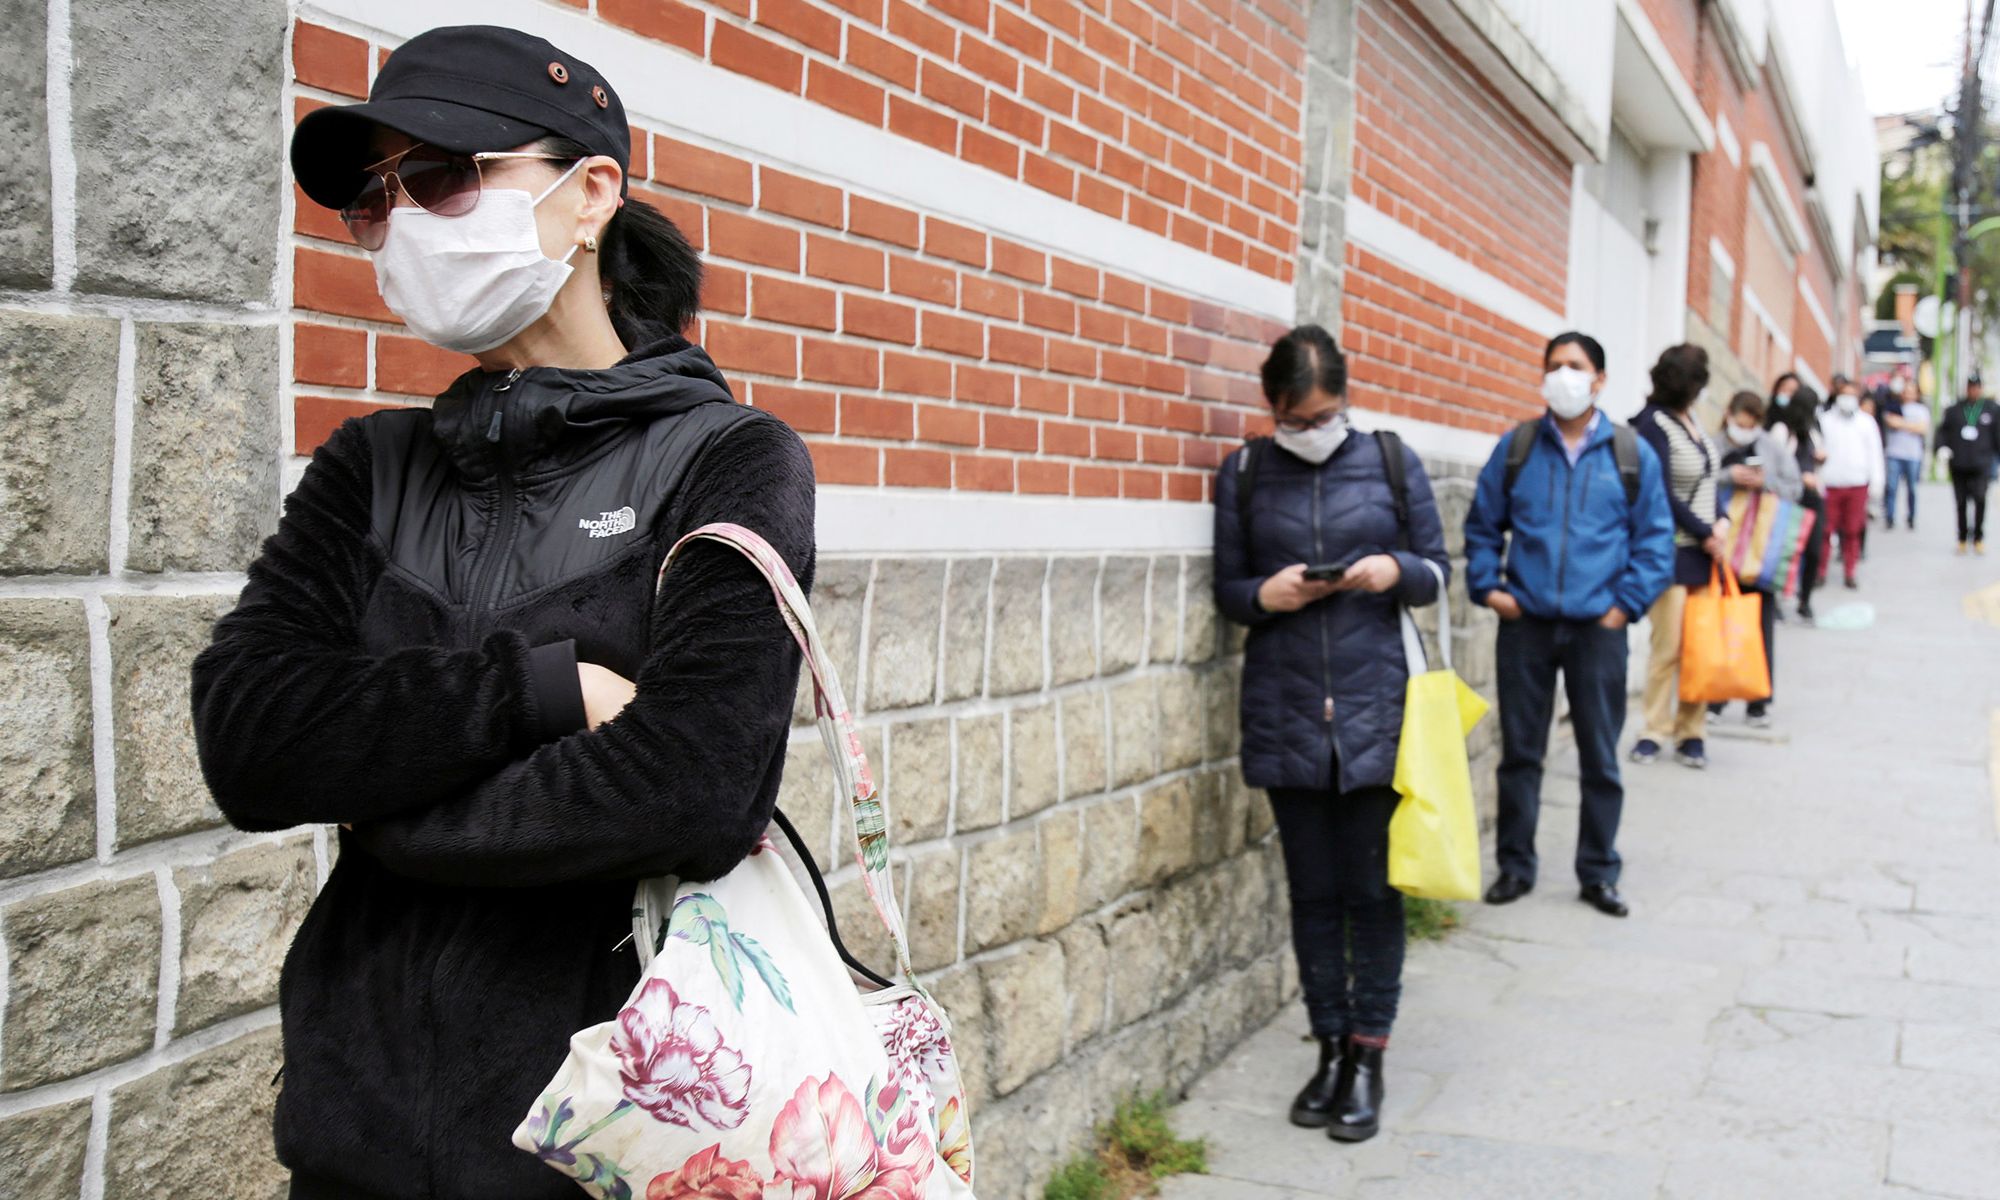
As the numbers come in this week, the evidence grows that social distancing is working, and the U.S. has avoided the worst-case scenarios of the pandemic. “This is an indication, despite all the suffering and the death that has occurred, that what we have been doing has been working,” Dr. Fauci said of this week’s data. “Keep it up,” he added.
While the data are confounded by testing constraints, after careful analysis, an MIT economist concluded that the curve is indeed flattening in New York City, which bodes well for other cities.
As of this morning, nearly 370,000 cases of coronavirus have been confirmed in the U.S., with almost 11,000 deaths.
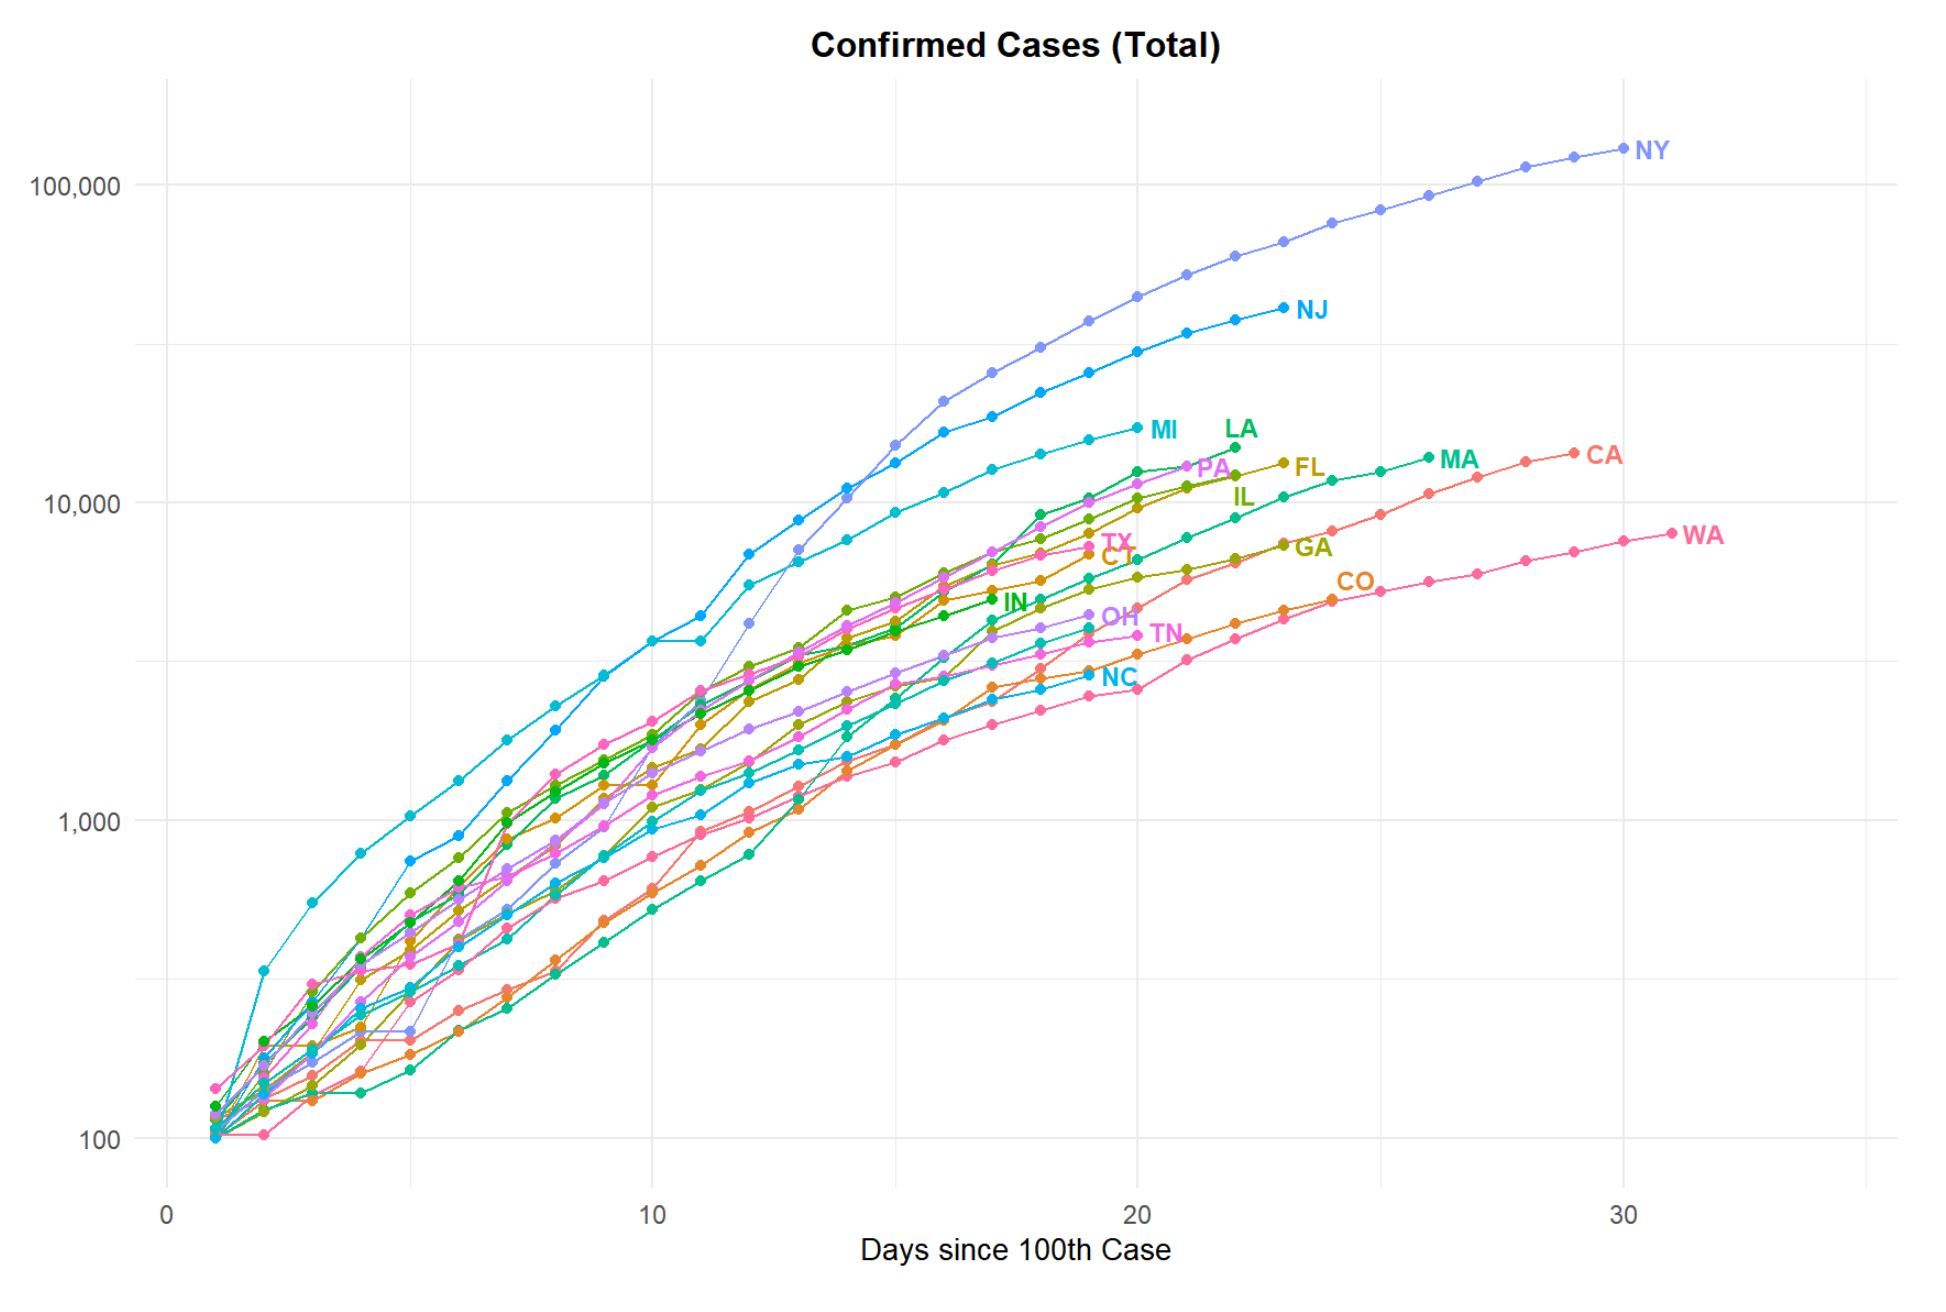
The growth rate in new cases continues to slow. The table below shows the average daily growth rate in new cases over the past five days and the change in that growth rate from five days prior. The negative percentages in the right-hand column reflect decreases in the growth rate across all of the hardest-hit states.
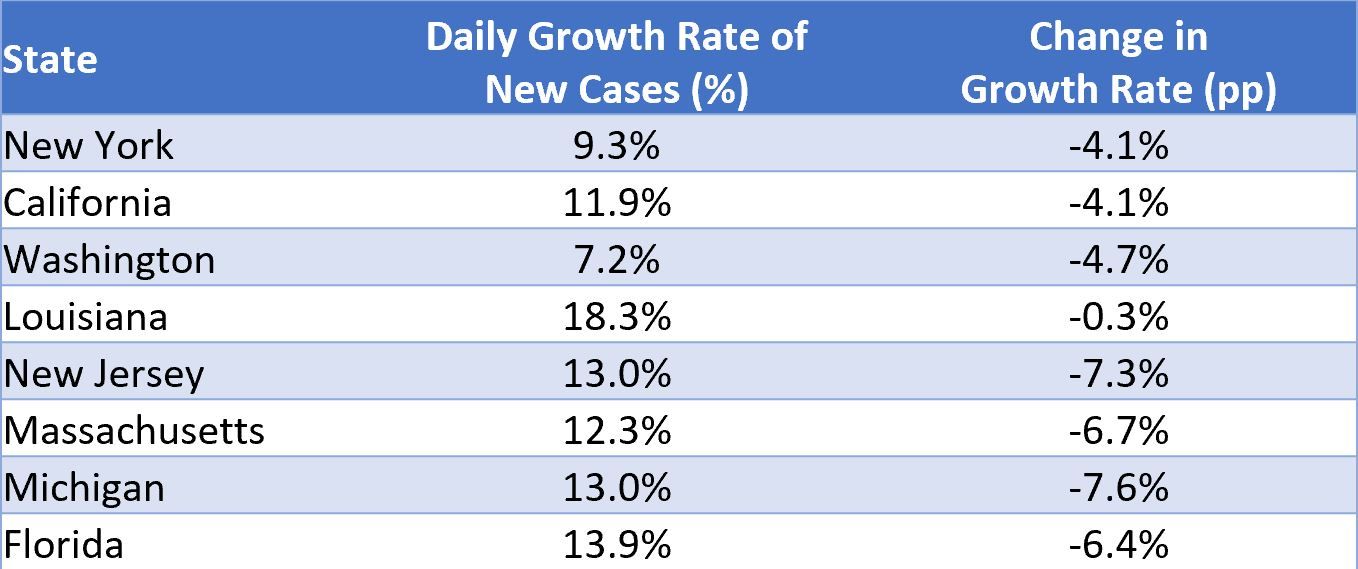
The slowing transmission is beginning to reduce deaths. In New York City, the number of daily deaths has been decreasing since the weekend. This indicates a decreasing strain on medical systems and reduces worries that hospitals will be overwhelmed with coronavirus cases.
However, Indiana is a curious exception. With only 5,000 cases, the state has nearly 1,000 coronavirus patients in intensive care, a far higher portion than the average. We’ll be watching the numbers from Indiana to see whether its high number of ICU admissions increases deaths.
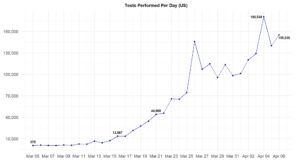
Testing continues apace, with just over 155,000 tests administered yesterday. That being said, delays in test results have persisted, especially in California. Quest Diagnostics, for example, reportedly takes up to 13 days to return test results.






Comments