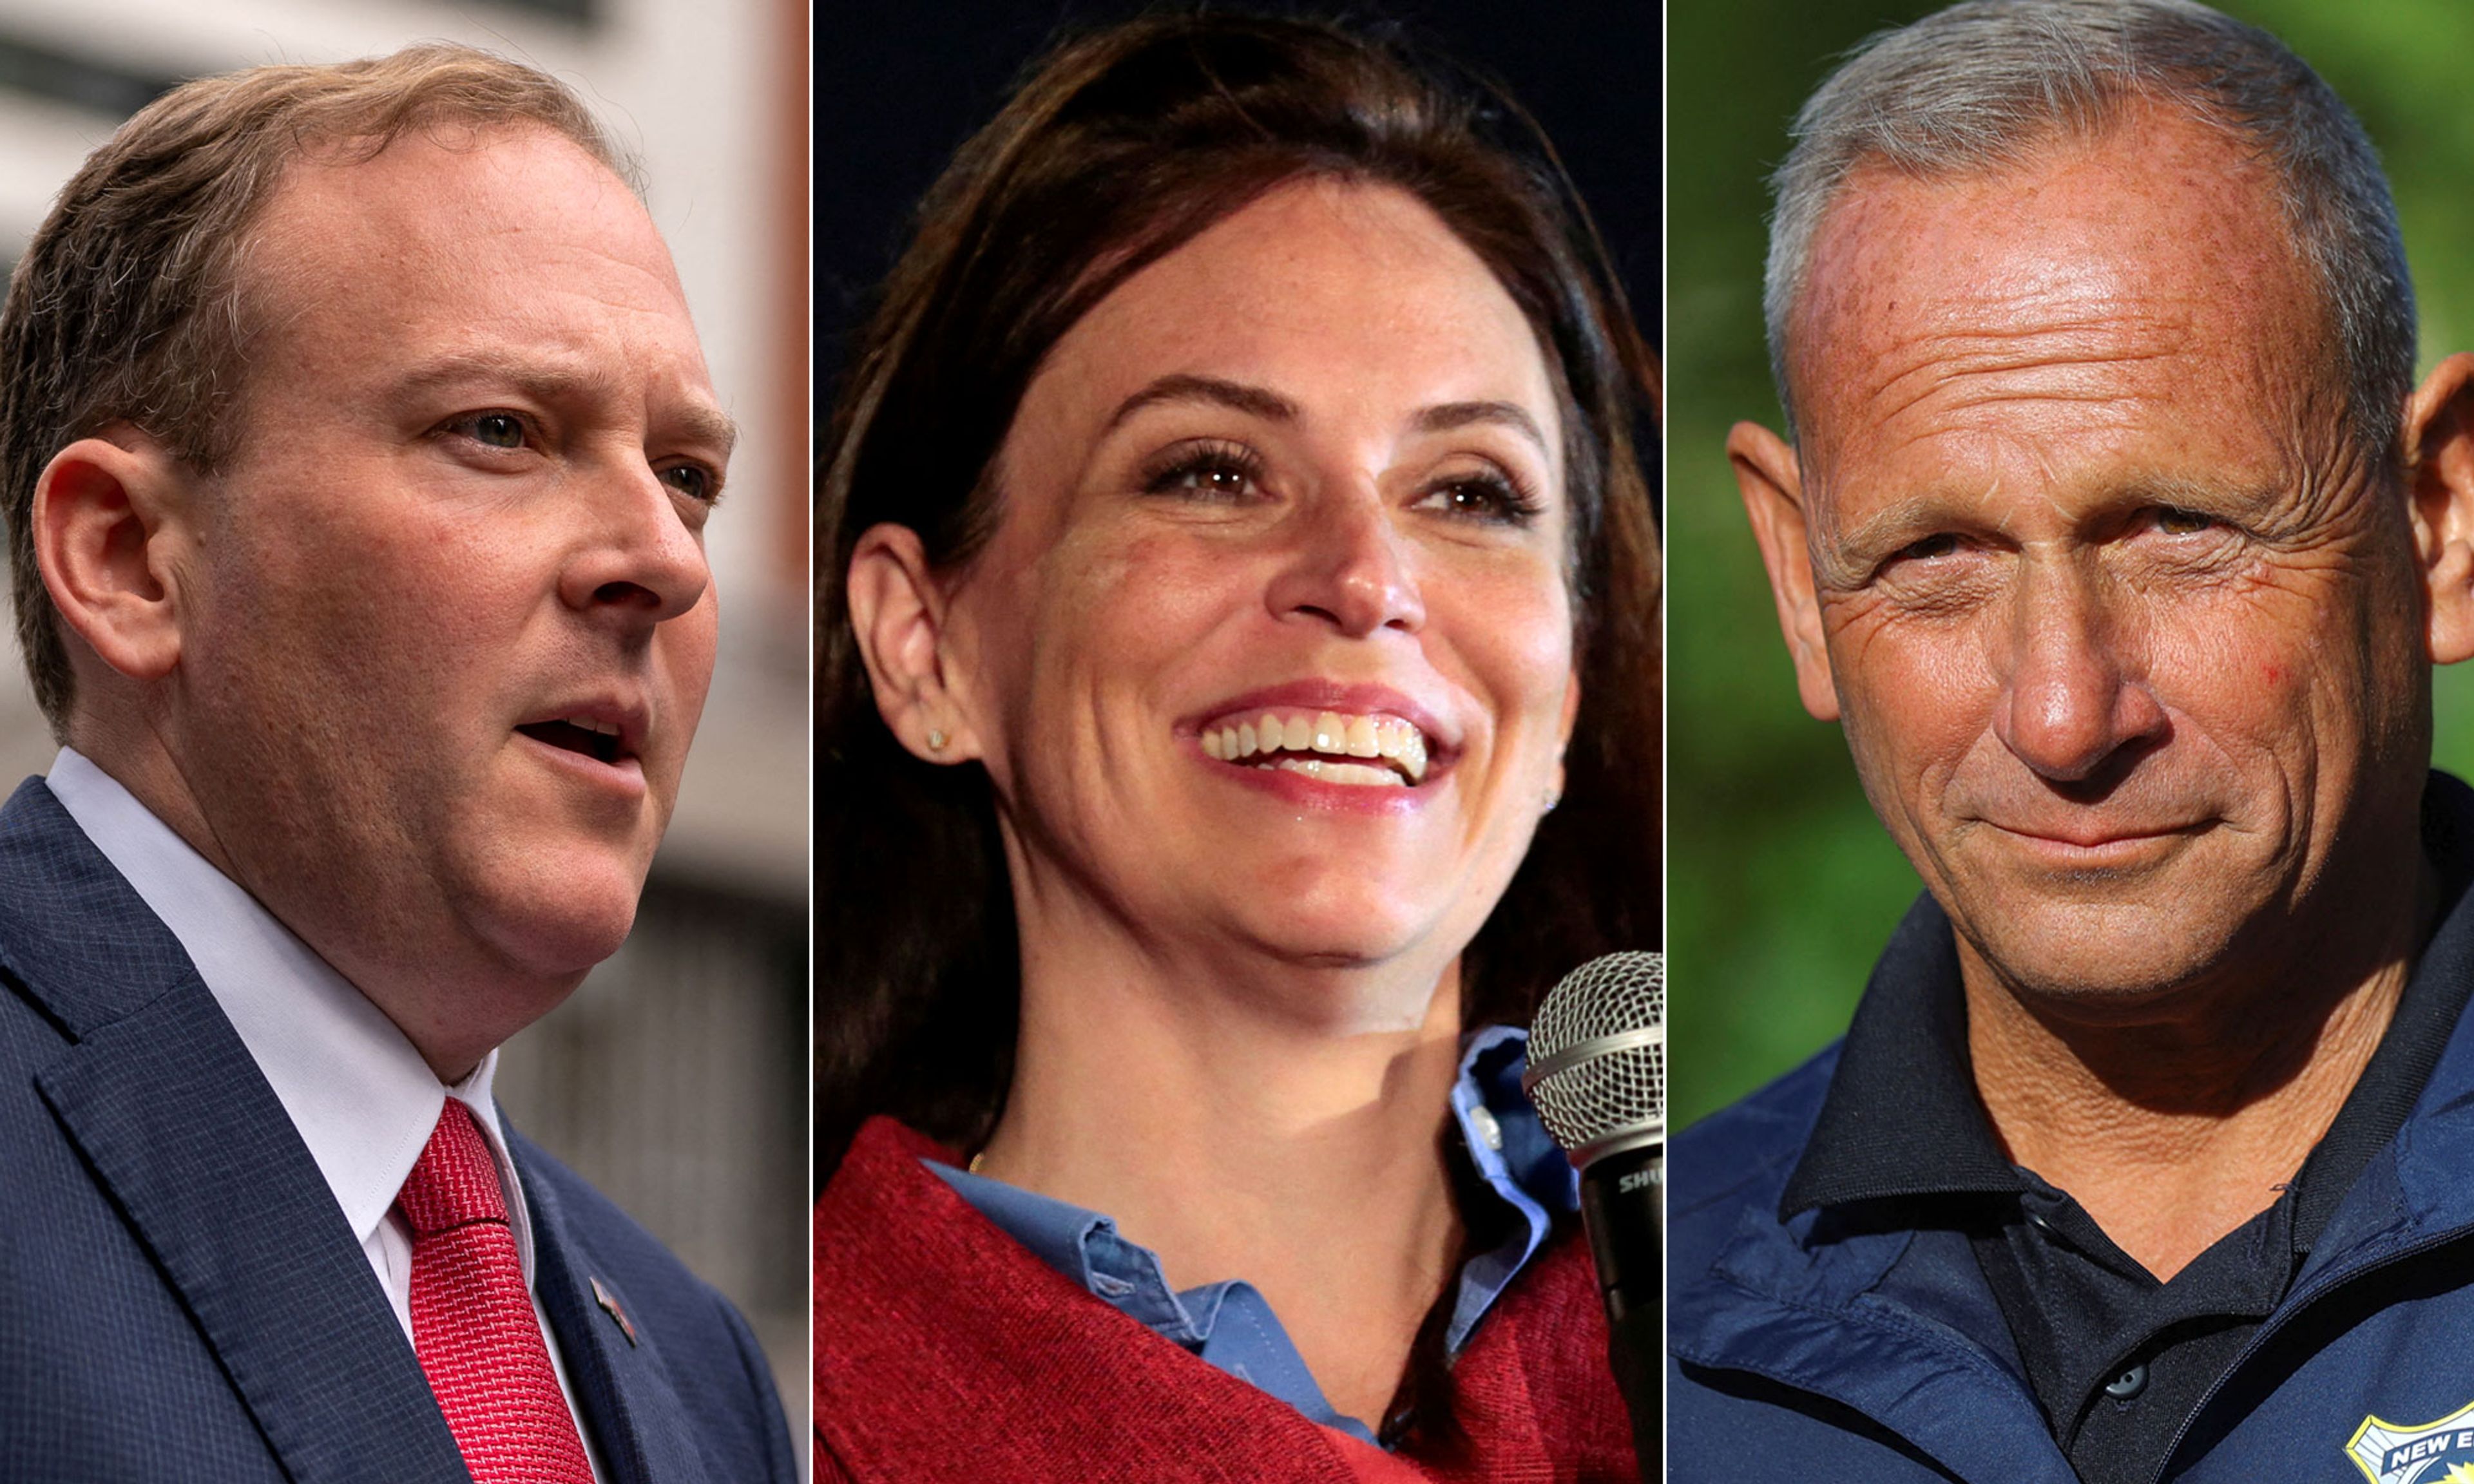
When projecting election outcomes on the basis of public polling, there are two questions worth asking: What is probable, and what is possible? If you always bet that the candidate leading in the polls will win, you’ll be right way more often than you’ll be wrong. A more sophisticated understanding, though, will take into account the average error across poll averages as well as the biggest wild cards: the leader’s margin and share of the vote, the number of undecideds in the poll, how many polls of the race have been taken recently, and the track record of pollsters and polls in a particular state.
That approach will give you a good idea of what’s probable. If you want to know what’s possible, on the other hand, you should start at the end rather than the beginning, isolating past races in which the polls got the outcome wrong. These are not the races that offer us the most likely parallels to the typical 2022 election; they are the outliers. Nor are they necessarily the races in which the gap between the polls and the results was the biggest; every year, in a certain number of elections, polls miss the margins of victory by a lot while still getting the winners right. Studying only the candidates who outperformed their polling numbers is a classic example of survivorship bias, which is problematic if you’re projecting probabilities. But it is still useful for setting candidates’ and parties’ ceilings and floors heading into Election Day.


Comments