The U.S. government is by far the world’s largest financial entity. When it moves, global financial markets reverberate, even if that was never intended. From December until May, the U.S. government withdrew almost $1 trillion of liquidity in its normal course of operations from the financial markets, and, regardless of the many other market cross-currents like inflation, monetary policy, oil, and war, this inadvertent tightening has been a major cause of this year’s financial market swoon.
A fundamental measure of financial-market liquidity is reserves held by financial institutions at the Fed. These are like checking accounts for banks. While institutions control their individual reserve balances by making loans or buying assets such as securities, such transactions just shift reserves to other institutions, so the overall level of reserves is largely determined by how many assets the Fed buys, as with its now-ceased Quantitative Easing asset-purchase program.
Fed policy is not the only determinant of the reserves level though; the elephantine U.S. Treasury keeps its own checking account at the Fed. Given the federal government’s extraordinarily high debt and expenditures, changes in the Treasury’s account at the Fed can add or withdraw reserves by hundreds of billions in short periods.
While changes in the Treasury balance are not intended to reflect monetary policy, they have the same effect. If the Fed sells securities directly to reduce reserves and tighten financial conditions, it has the same effect as the Treasury selling debt and leaving the balance at the Fed. Normally, swings in Treasury balances even out over time, but 2022’s first months were an exception.
Since the debt-ceiling resolution in December, when the Treasury account was at a low point of $58 billion because it couldn’t sell debt, the balance rose to $964 billion at the beginning of May. The increase was due in part to attaining the Treasury’s desired balance of $650 billion and in part to Treasury being surprised by over $250 billion in tax receipts. The chart below demonstrates the close connection in this period between changes in the Treasury balance and the level of reserves at the Fed.
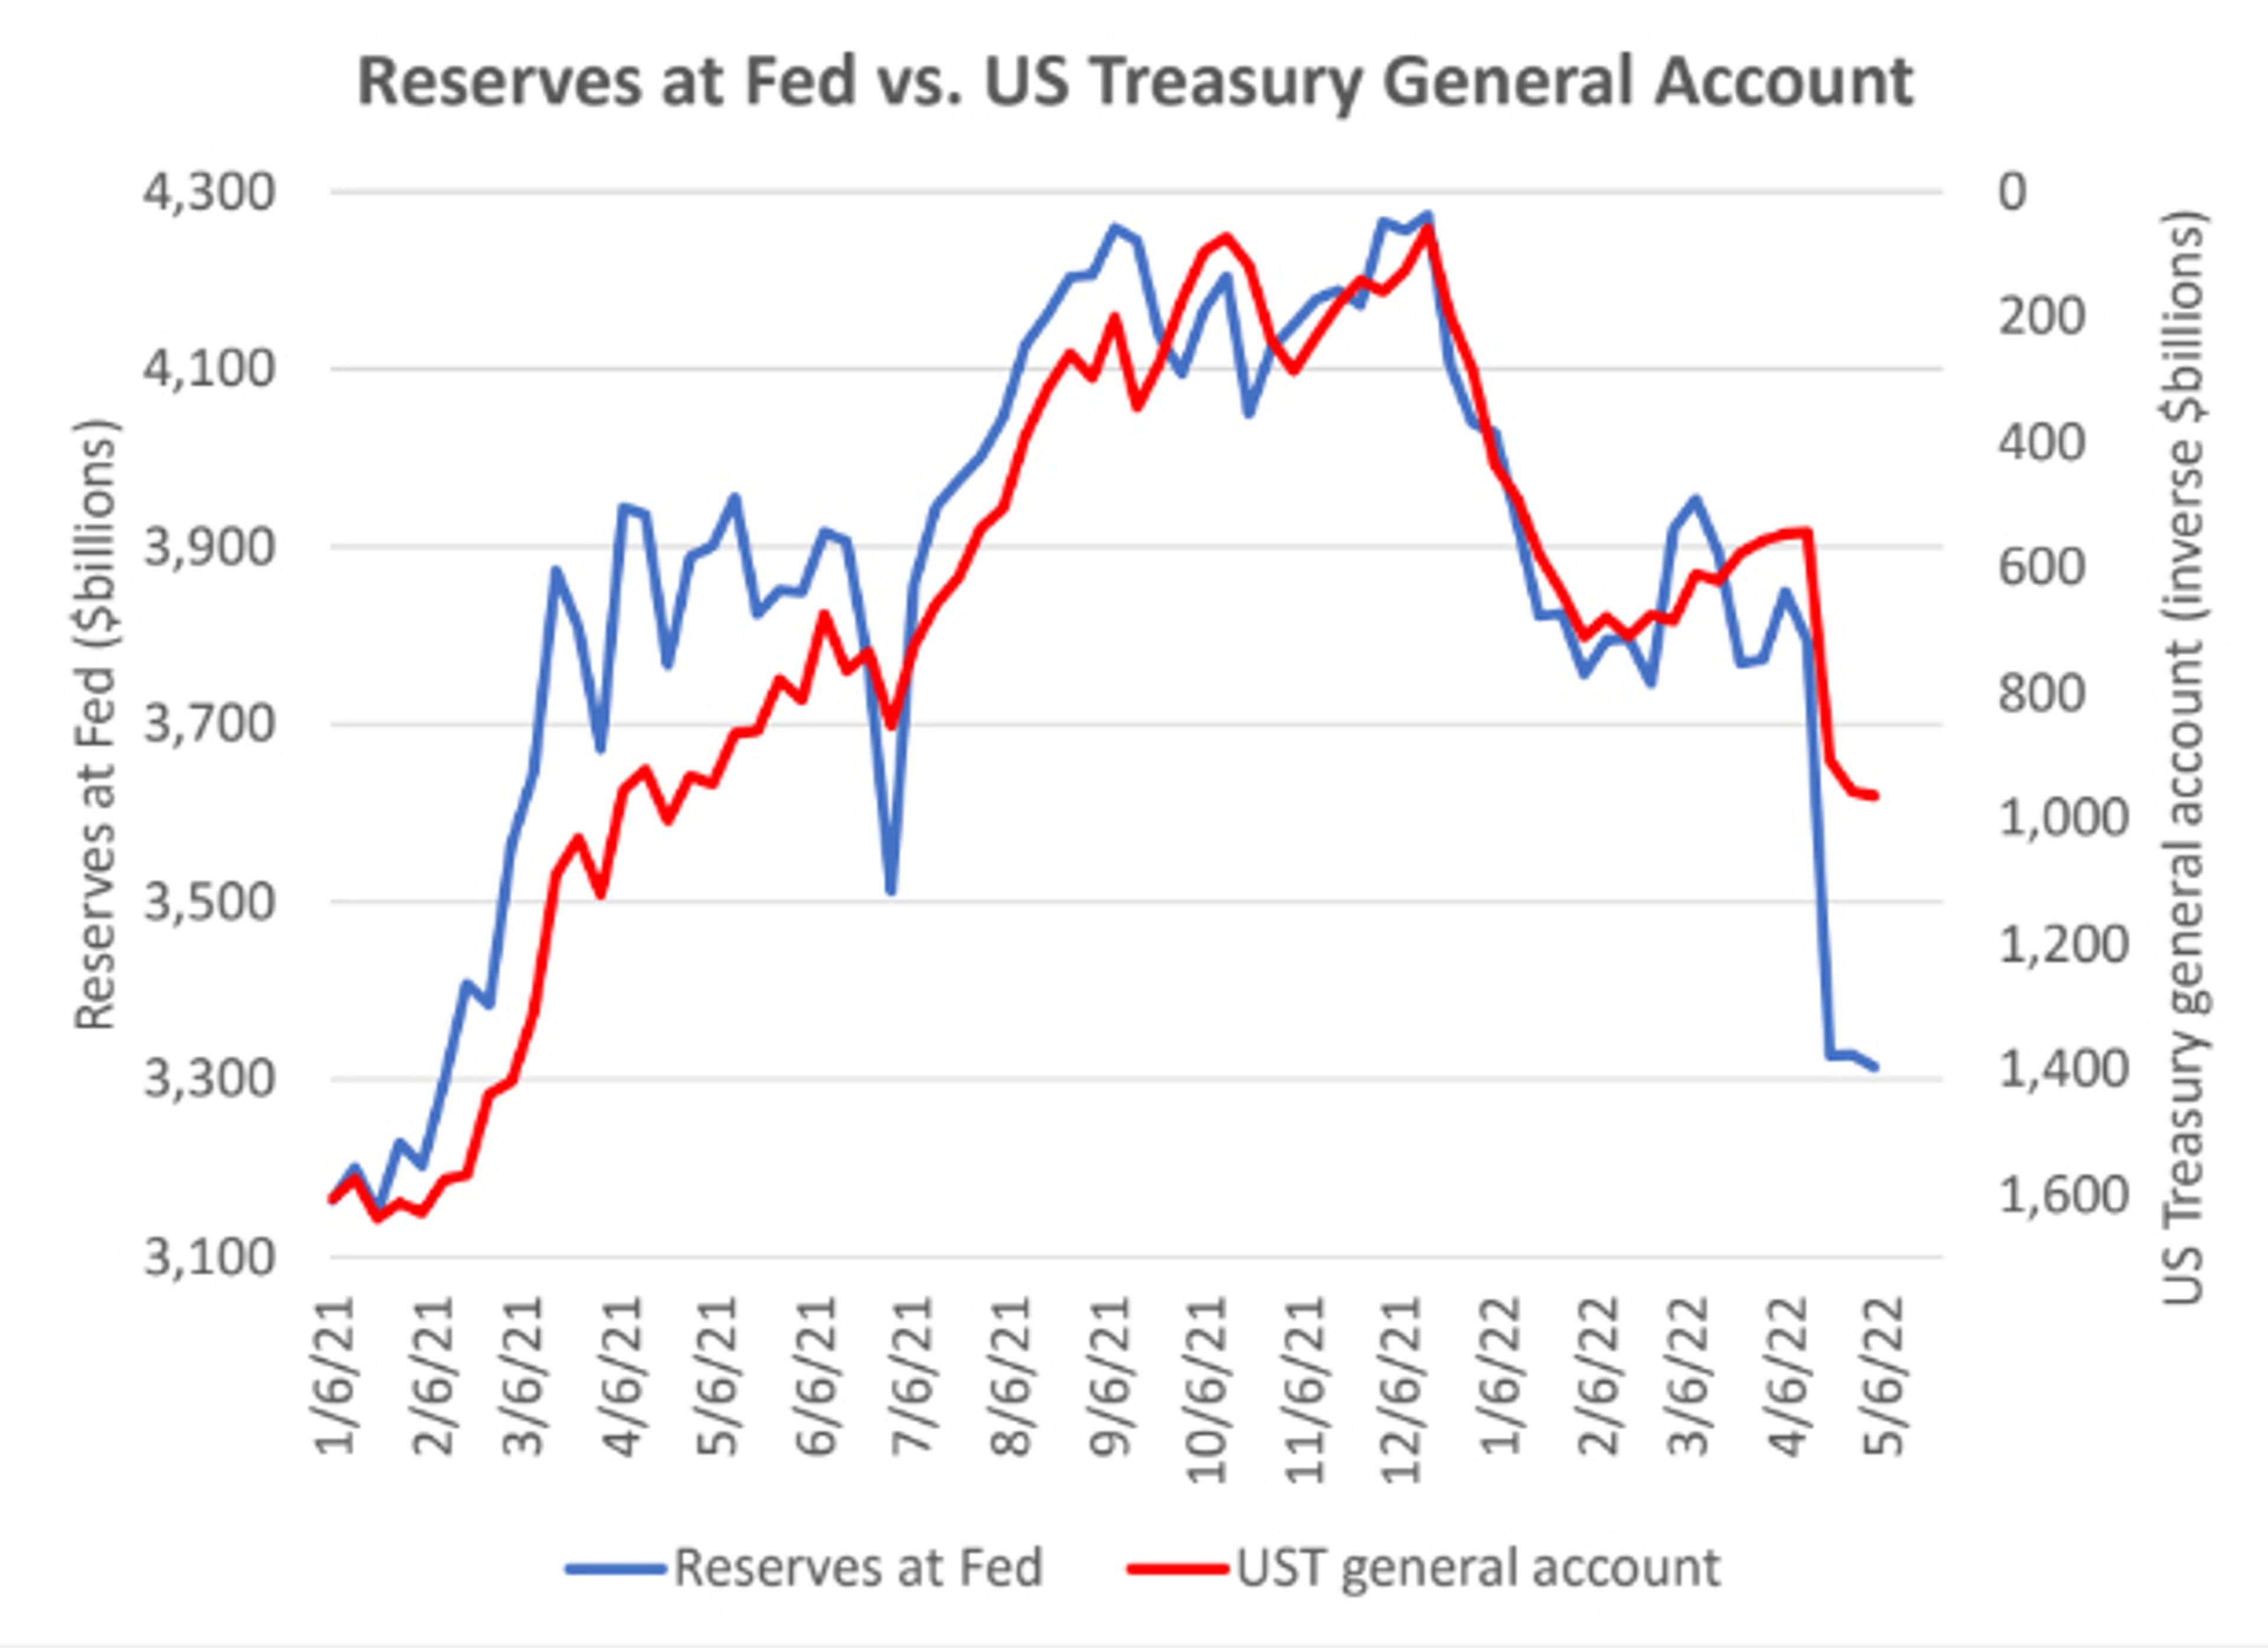
The decline in liquidity since December 2021, represented by reserves at the Fed, is largely driven by the increase in Treasury’s account. The changes in reserves liquidity are closely tied to changes in the financial markets as represented by the Standard & Poor’s 500 in the next chart.
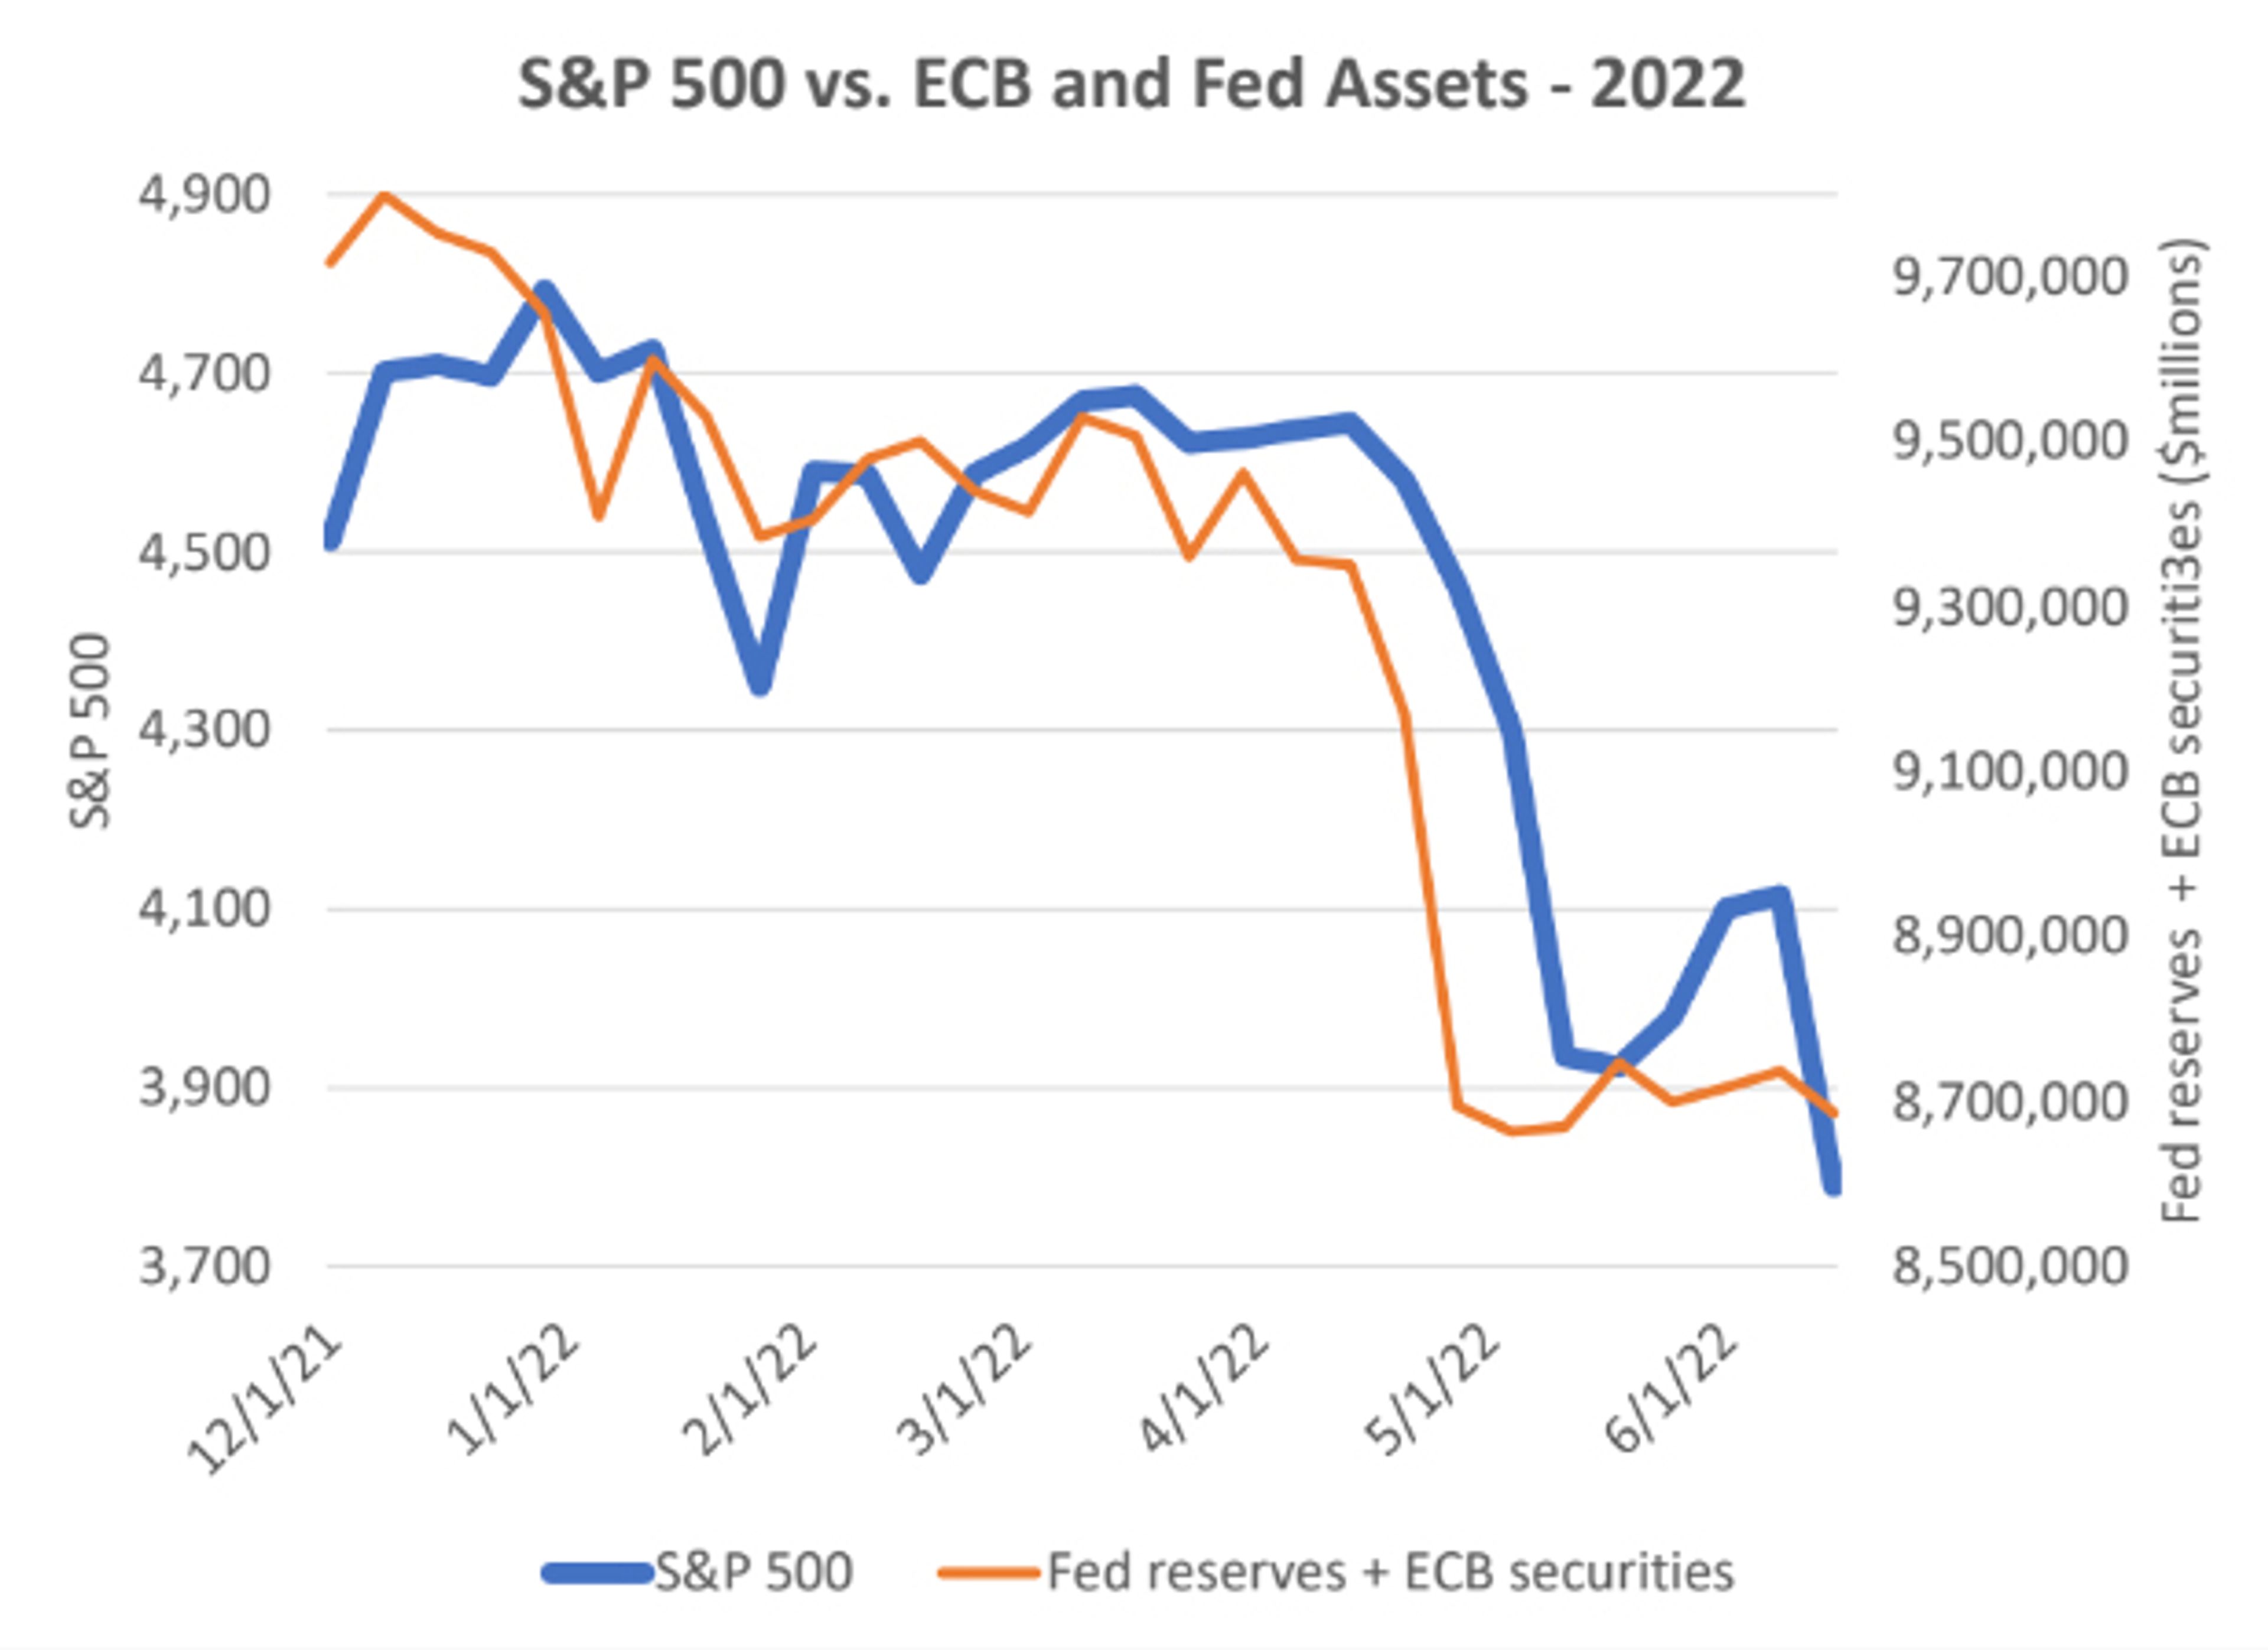
A decline in the Treasury balance of $163 billion contributed to the stock-market rally at the end of May.
With all the wild events of the last few months, central-bank liquidity appears to have the most significant influence. Liquidity from reserves at the Fed as well as ECB securities purchases explains over 50 percent of market variability during this time.
The strength of the relationship between liquidity and the stock market normally is far higher. The following chart illustrates, since the Great Financial Crisis, central-bank liquidity explains as much as 97 percent of stock market movement. (Before the GFC and swollen central-bank balance sheets, this relationship was significant, but only explained single-digit percentages of market variability.)
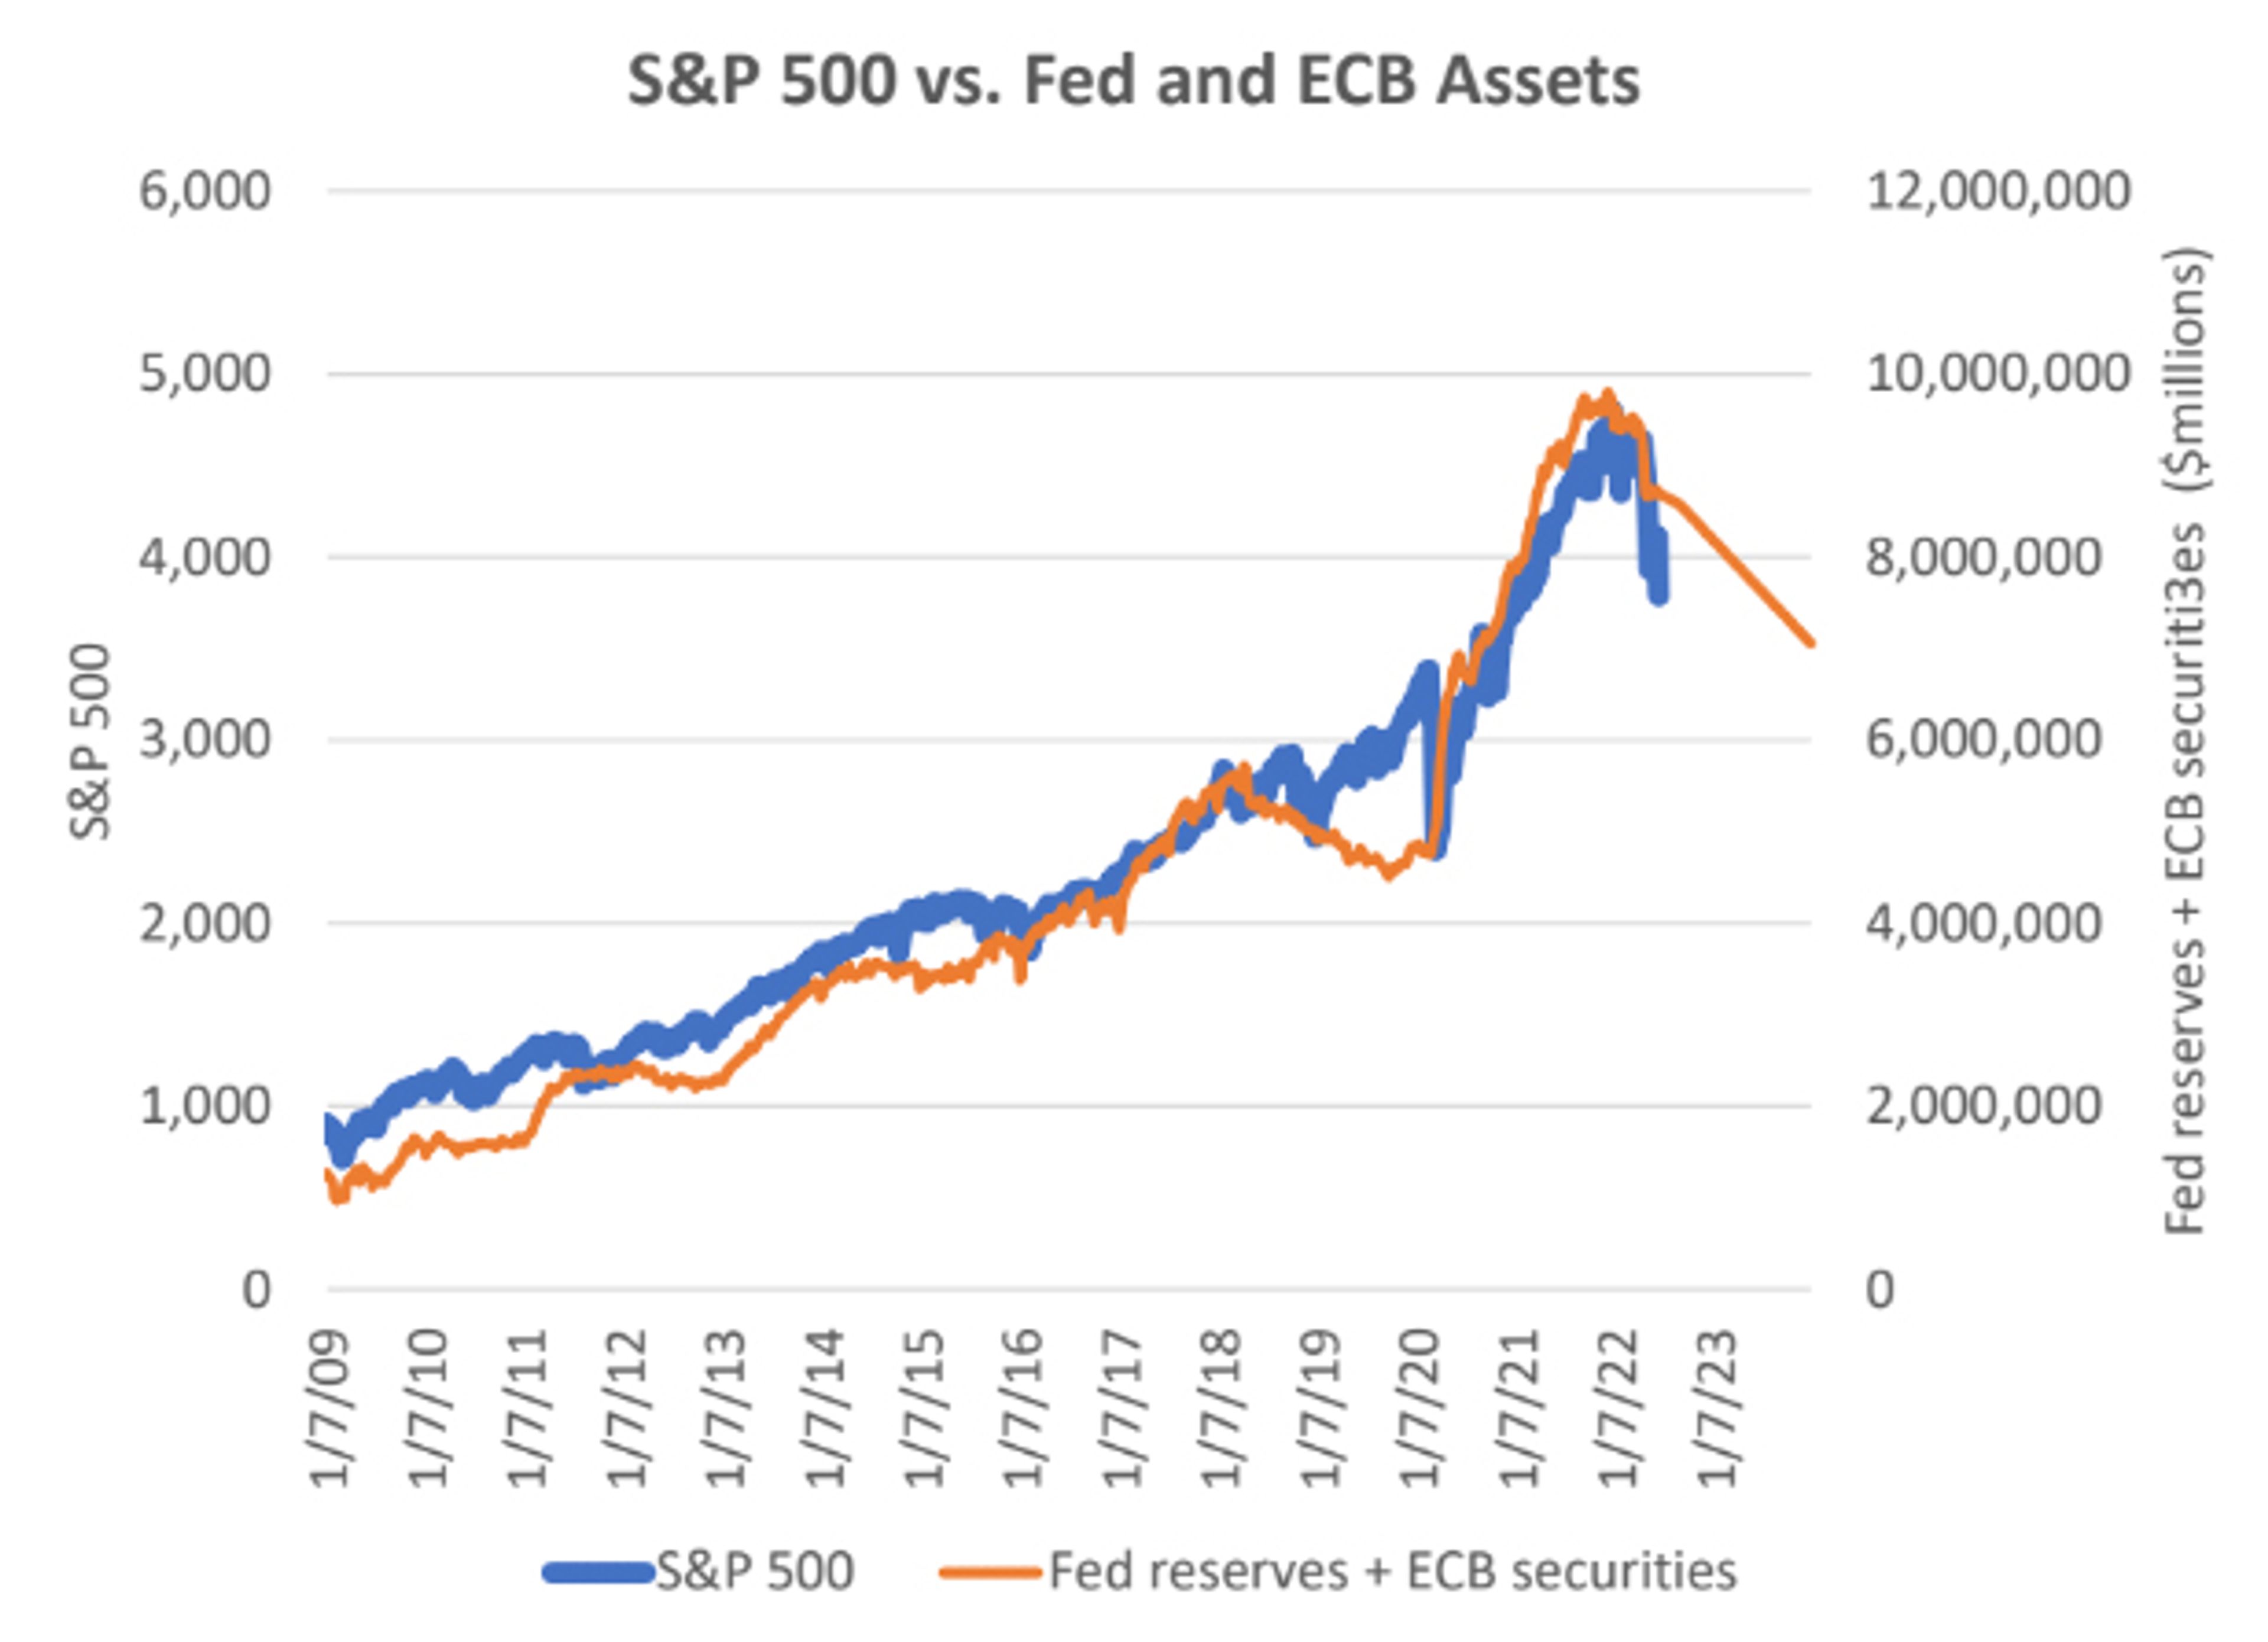
Of course, there are many significant factors influencing the stock market at any given time, but, if during the central-bank-bubble era, valuations appear divorced from traditional fundamental criteria, the impact of excess liquidity explains the split.
While equities are used in these charts to demonstrate the impact of government operations and policies, that asset class is only representative of a broader array of financial assets such as mortgages, bonds, and spreads between bond categories.
Bond yields before and after the pandemic may be affected by different inflation rates, but yields on inflation-adjusted bonds, or TIPS, provide an even comparison. The chart below shows how these yields are influenced by central-bank liquidity.
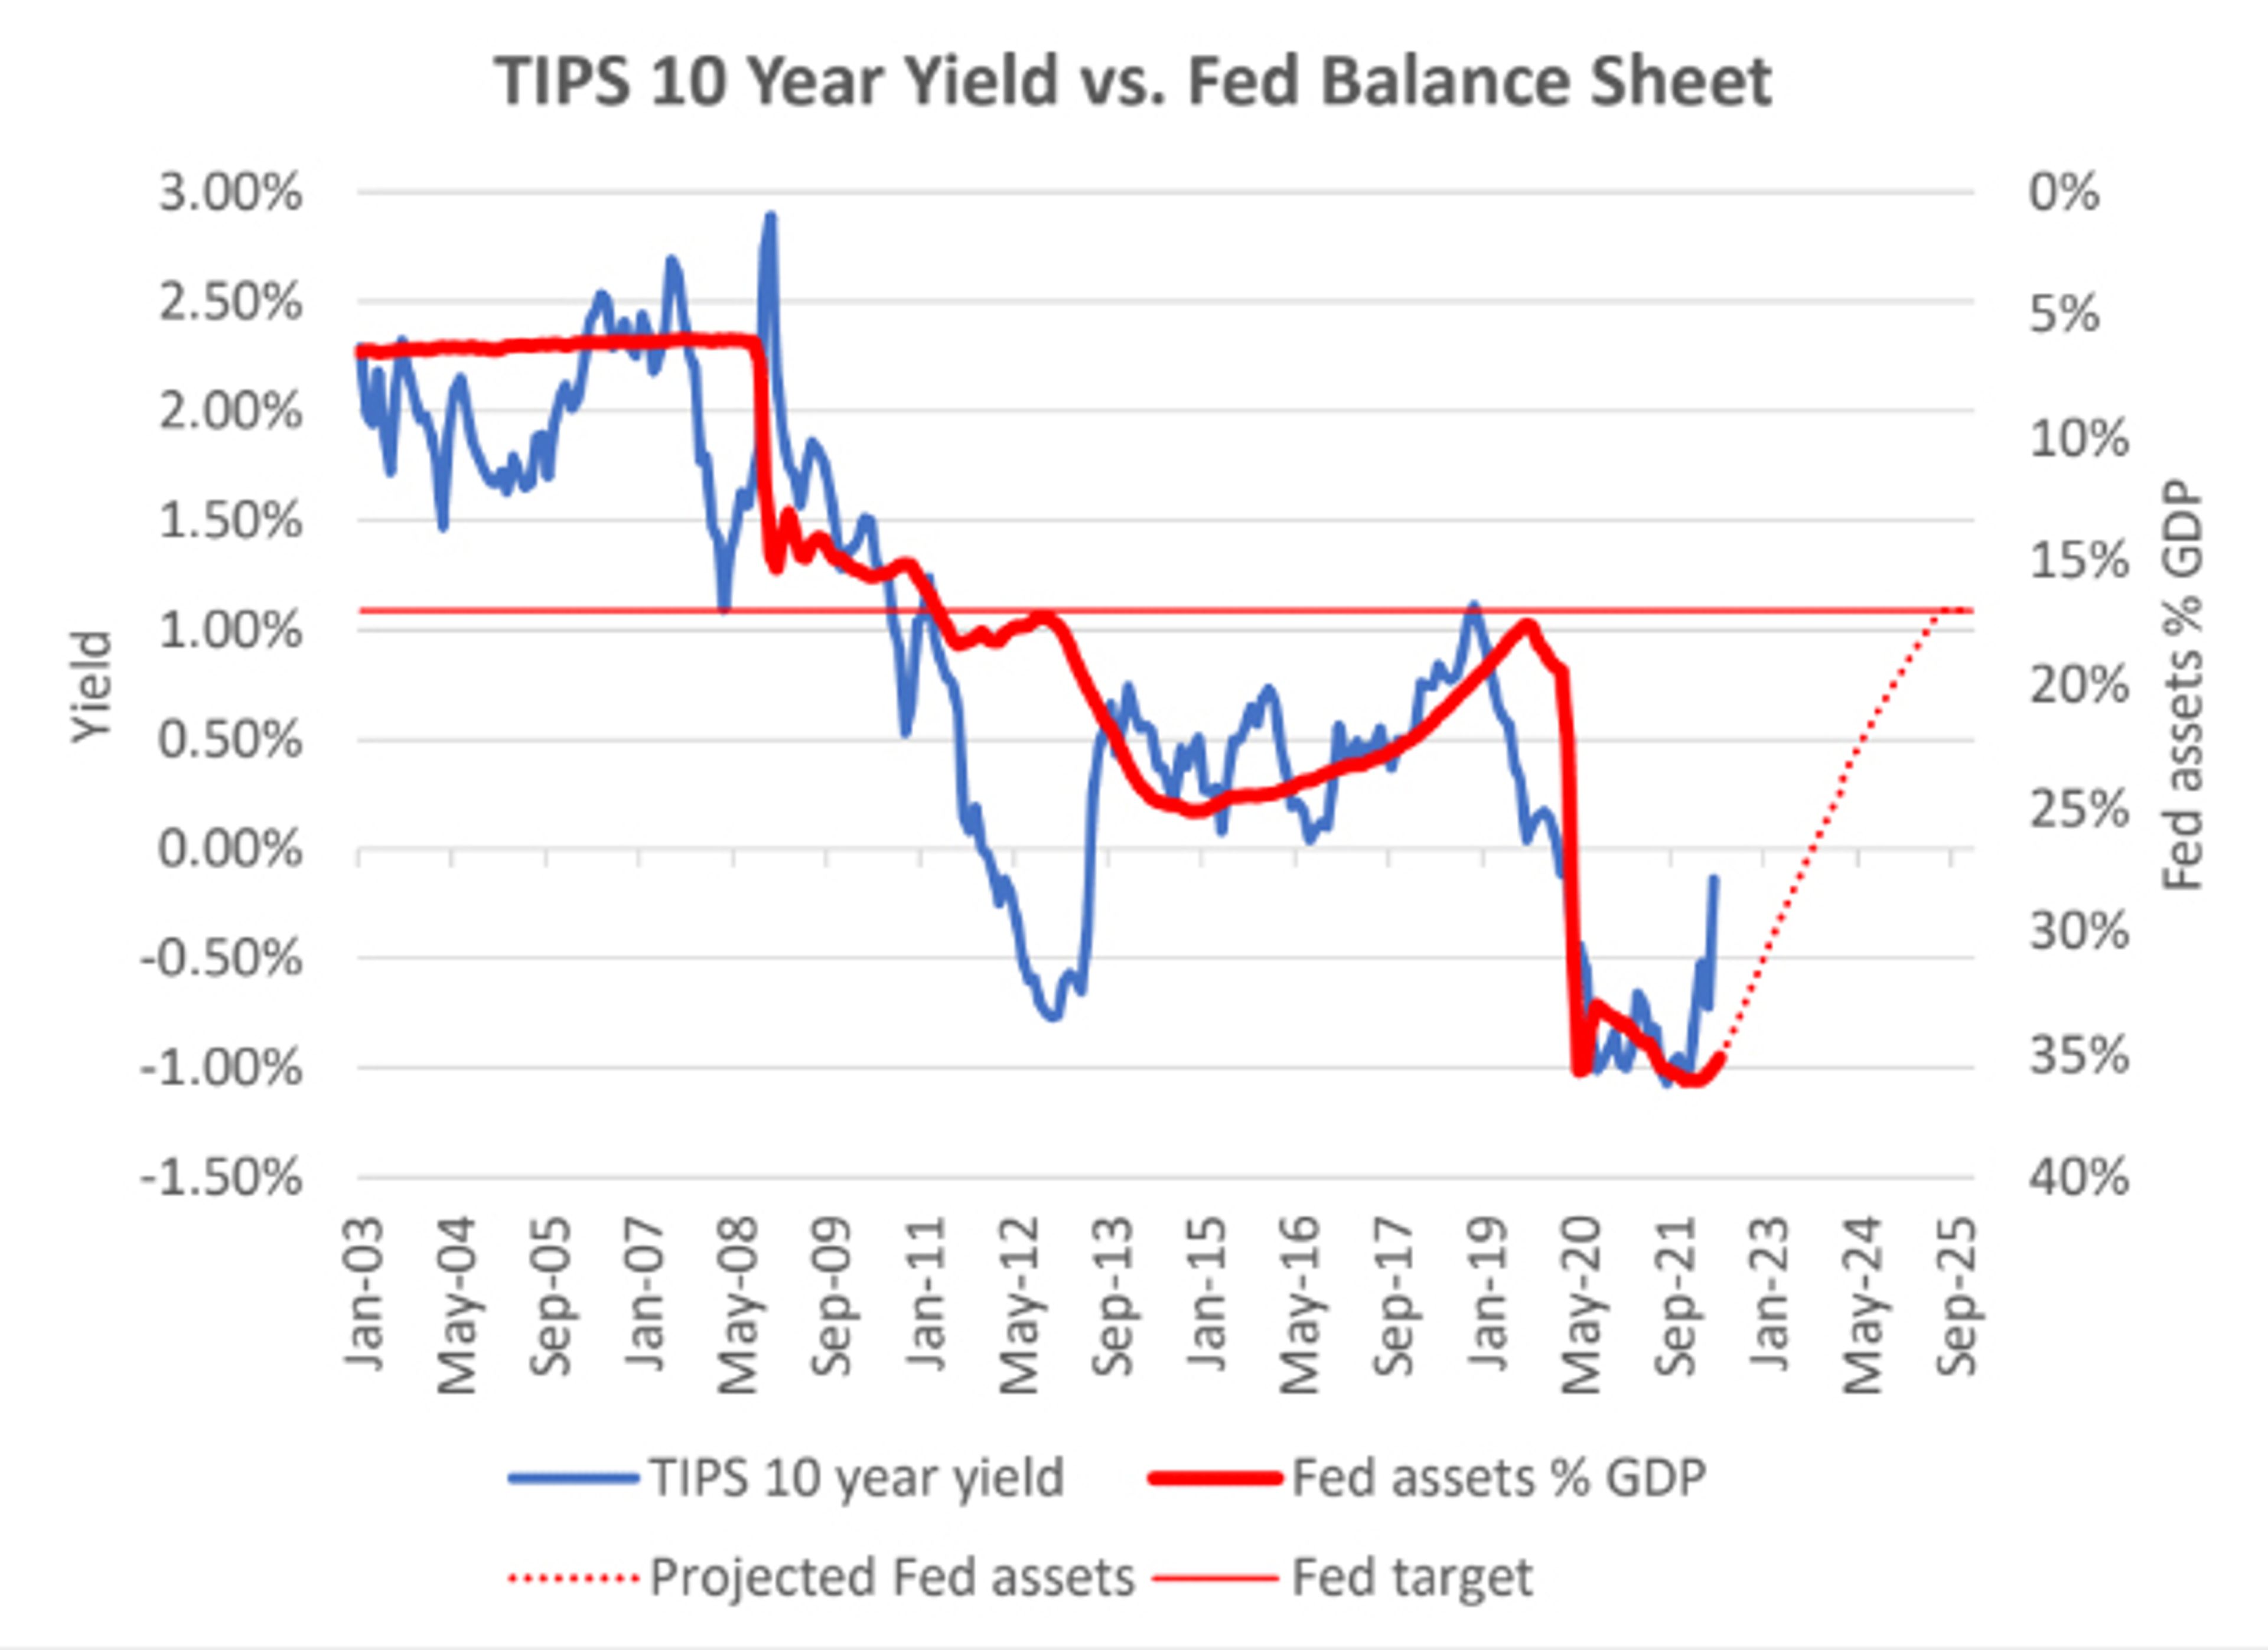
Beginning this June, the Fed is expected to return its balance sheet to pre-pandemic levels of about 17 percent of GDP. If historical relationships in the chart apply, this produces a 1.00 percent real, after inflation, bond yield. Combined with the Cleveland Fed’s highly regarded ten-year expected inflation measure of 2.35 percent, the implied yield for U.S. Treasury ten-year notes comes to 3.35 percent, a level approached recently.
To be sure, skeptics of the relationship between liquidity and asset prices abound, but the relationship is overwhelmingly strong with appropriate measures for liquidity including systemically important foreign central banks.
The Fed itself may be skeptical of the relationship, as it is blithely proceeding on a path to reduce reserves by around $2.5 trillion to reach a 17 percent of GDP asset level, but the Fed’s own research shows a strong relationship between its balance sheet and bond yields. This can extend naturally to other financial assets as well. The Fed may be complacent since its 2018-2019 quantitative tightening reduced its balance sheet by over $650 billion with just a 12 percent market downdraft, but during this time, the ECB increased its securities assets by the equivalent of over $260 billion. The next round of Fed quantitative tightening will see the ECB reduce its balance sheet significantly.
The Fed’s monetary practices may further destabilize markets. To control interest rates, the Fed offers a type of deposit called reverse repos, but, in a panicked environment, financial institutions may build their reverse-repo balances in a “flight to safety,” withdrawing yet more liquidity from the financial markets at the most inopportune time.
It is not asking the government for a special favor or another market “put” to ask it to avoid destabilizing the markets. For operational fluctuations in Treasury balances, the Treasury can return to its pre-GFC practice of depositing debt-sale proceeds with private financial institutions, keeping funds in the financial markets, rather than withdrawing them to the Fed. To the extent the Treasury keeps major balances with the Fed, the central bank can sterilize them with offsetting securities purchases, again leaving financial-market liquidity unaffected.
The Fed’s long-term plan to shrink its balance sheet is necessary to return sanity to asset pricing, but how they get there makes all the difference. Shrinking through the financial markets is destabilizing, while shrinking outside the financial markets, through swaps of Treasury securities for reserves, minimizes the damage.
The last five months of financial carnage should make this message abundantly clear.




Comments