
Over at FiveThirtyEight, Nate Silver is running a fascinating series of pieces explaining the “real” story of 2016 — with an emphasis on explaining how and why so many people looking at the same data and made the same mistakes. For example, here’s Silver dealing with the perception that Democrats enjoyed the protection of a “blue wall” in the electoral college:
What was wrong with the “blue wall” idea? You can read our longer critique here, but the gist of it is that looking at a state’s long-term voting history told you almost nothing about how it was likely to behave the next time around. California and Vermont had once been reliably red states (they had voted Republican in each election from 1968 to 1988) until they suddenly weren’t. In 1992, the first year of the “blue wall,” Arkansas and West Virginia were more Democratic than Connecticut. A state’s short-term voting history (how it voted in 2012 and 2008) might tell you something more, by contrast. But that information needed to be interpreted carefully because states rise and fall with the national tide.
And here’s Silver discussing the “emerging Democratic majority” thesis, the idea that demographic changes would guarantee Democratic success:
But the “emerging Democratic majority” had a lot of flaws, some of which had been pointed out by data-savvy journalists for years. (See for example Real ClearPolitics’s Sean Trende, The Upshot’s Nate Cohn, and FiveThirtyEight contributor David Wasserman.) One basic problem with the theory is that while white voters without college degrees might have been declining as a share of the electorate, they still represented a hugely influential group and significantly outnumbered racial minorities in the electorate. According to Wasserman’s estimates, 42 percent of voters are whites without college degrees. By comparison, 27 percent of voters are nonwhite. If white noncollege voters were to start voting Republican by the same margins that minorities voted for Democrats, Democrats were potentially in a lot of trouble, even if they also made gains among college-educated whites.
Furthermore, whites without college degrees are overrepresented in swing states as compared to the country as a whole. Sure, there were some exceptions, such as Virginia. But in the average swing state — weighted by its likelihood of being the tipping-point state — whites without college degrees make up an average of 45.3 percent of the electorate, higher than their 41.6 percent share nationwide. That’s a big part of why Clinton won the popular vote while losing the Electoral College.
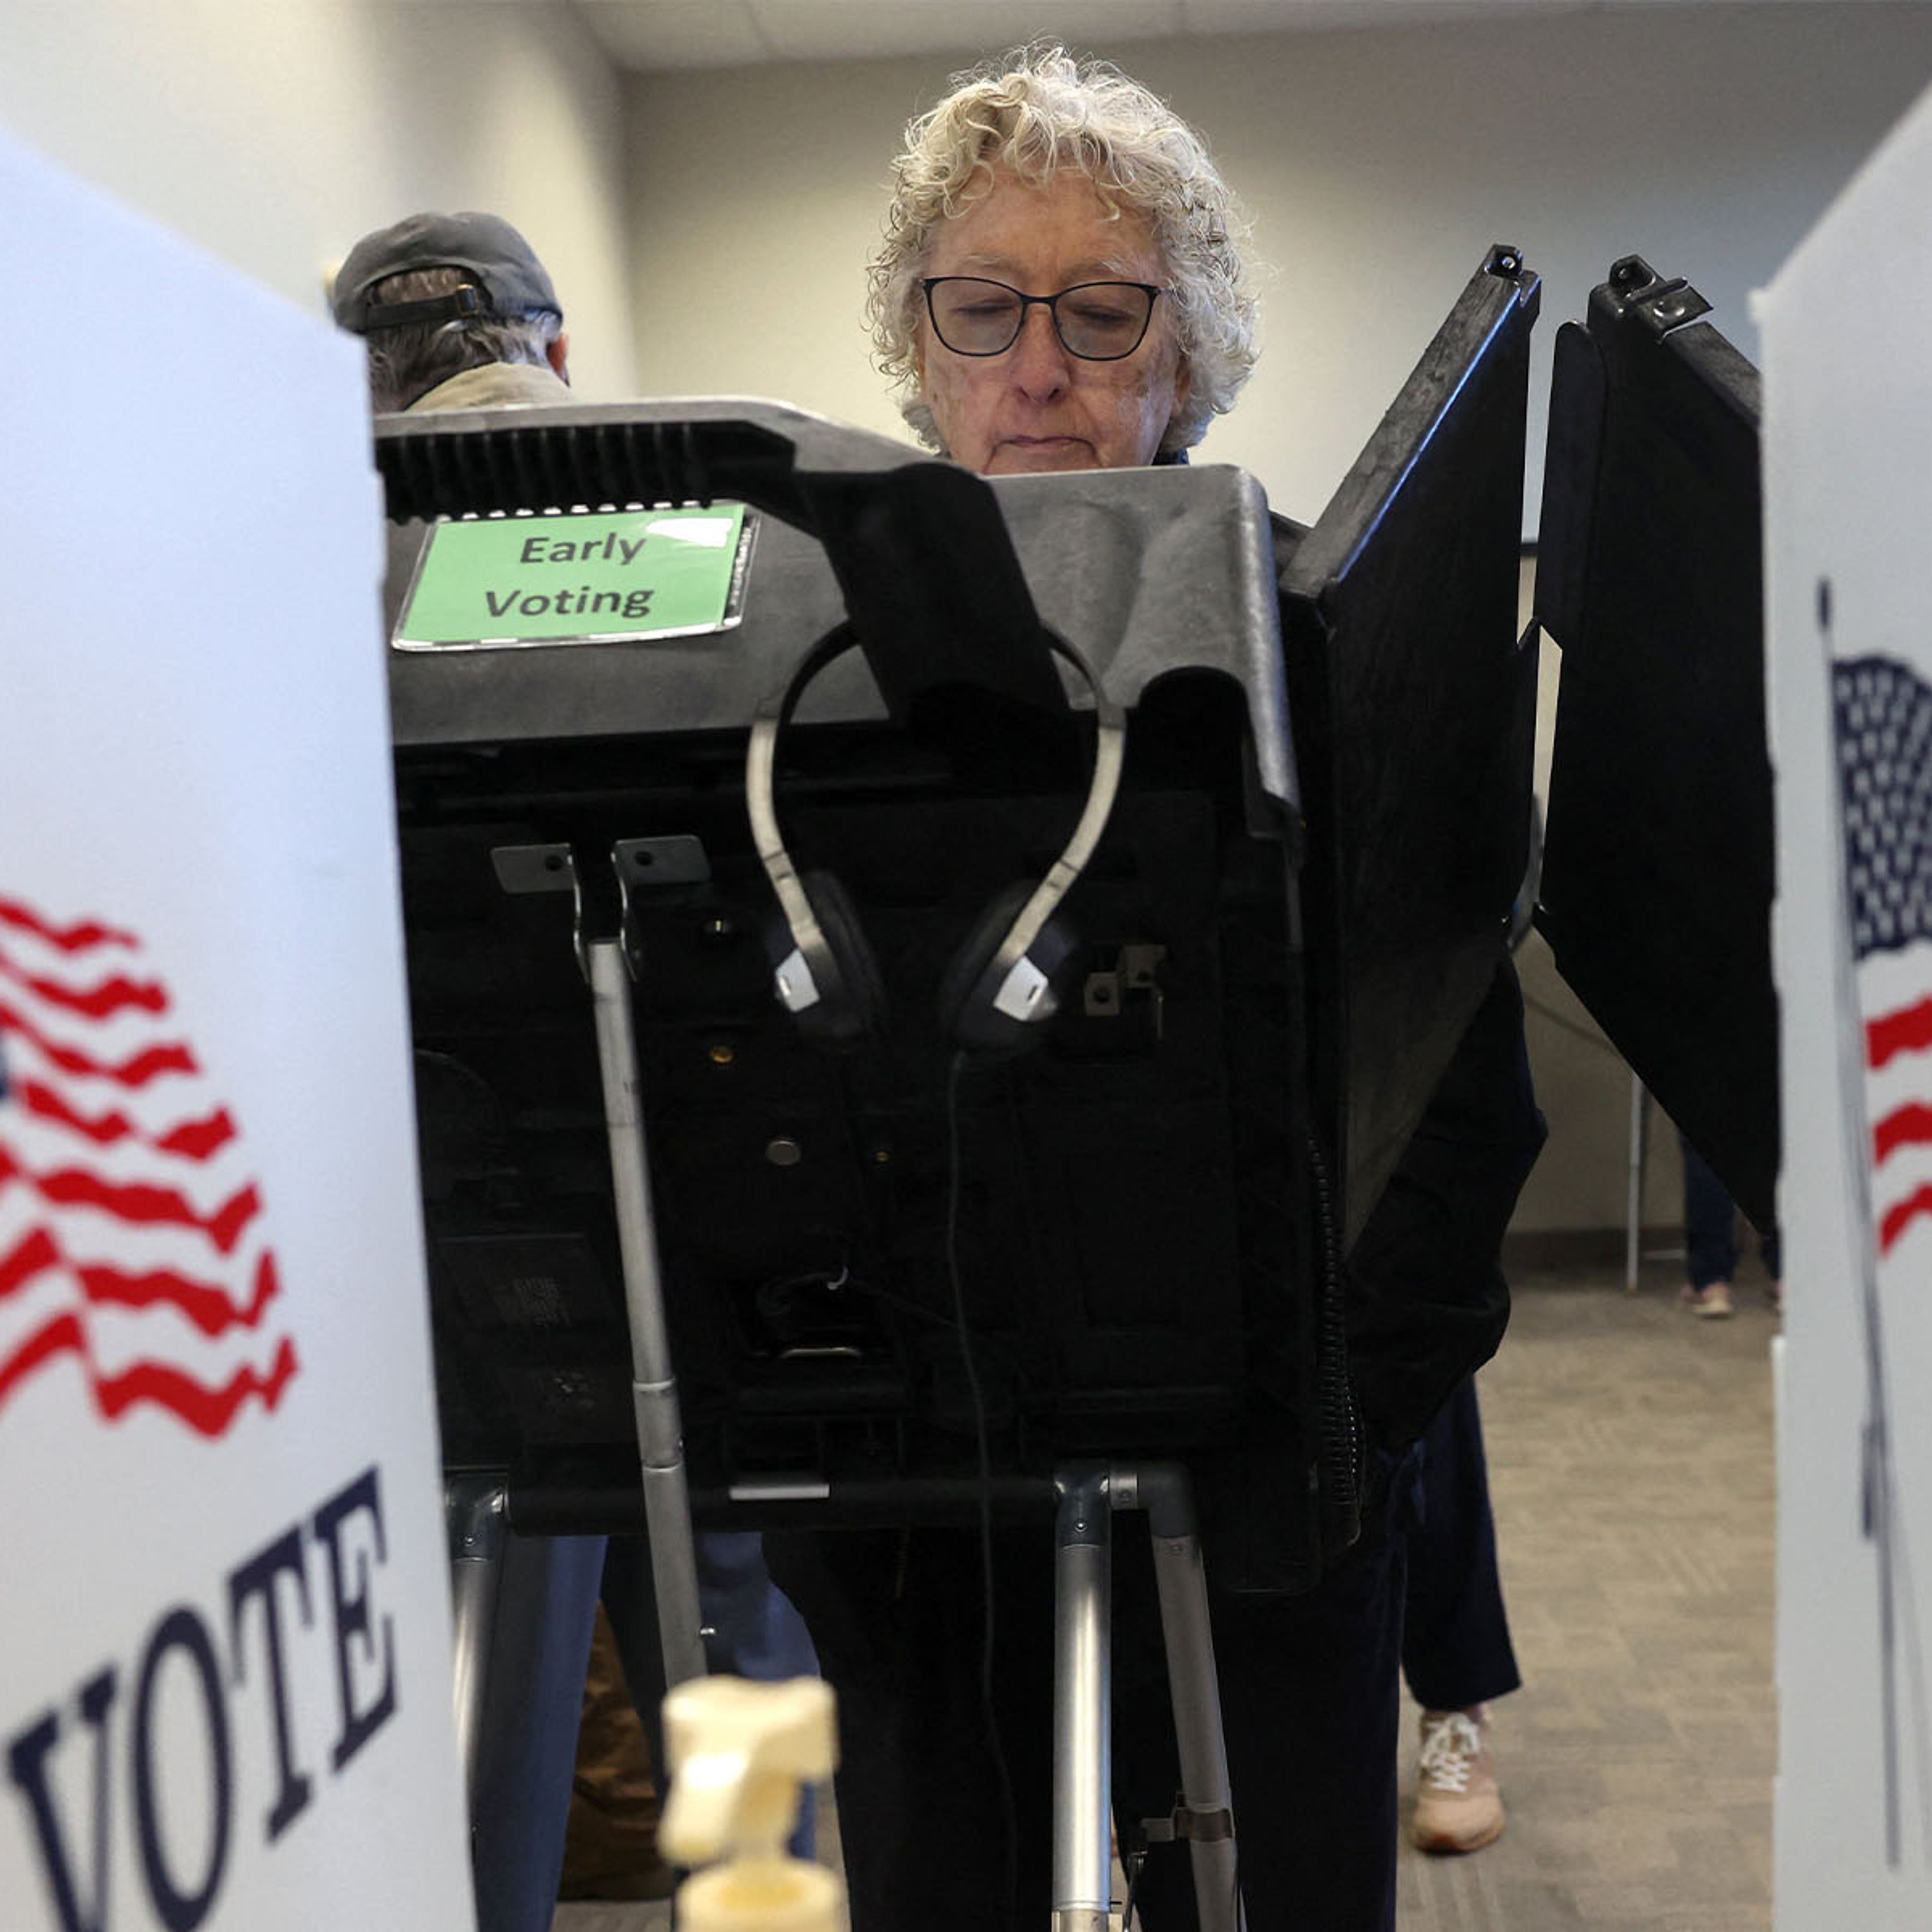
Then there’s the notion that early voting was somehow giving Hillary an insurmountable advantage:
Some statistical indicators are more useful than others. Data on early voting, for instance, usually doesn’t provide much predictive insight. Historically, the relationship between early voting in a state and the final voting totals there has been weak, and attempts to make inferences from early voting data have made fools of otherwise smart people. In the 2014 midterms, Democrats used early-vote numbers to claim that the polls were underrating their chances. Instead, it was Republicans who substantially beat the polls.
None of this deterred reporters and analysts from frequently citing early vote data in the closing weeks of last year’s presidential campaign, very often taking it to be a favorable indicator for Hillary Clinton.
And this insight, regarding the way we imbue the term “data” with almost mystical power is spot-on:
There’s also a broader point to be made about the use and abuse of data in campaign coverage. After the election, some of the pundits who had touted Clinton’s early voting numbers as an alternative to polls claimed that “the data” was wrong and had led them astray. And the Times, which had spent a lot of time reassuring its readers that Clinton would win, wrote an article entitled “How Data Failed Us in Calling an Election.”
Whenever I see phrasing like this, I mentally substitute the near-synonym “information” for “data” and reconsider the sentence. Would the Times have published a headline that read “How Information Failed Us in Calling an Election”? Probably not, because that sounds like the ultimate dog-ate-my-homework excuse. Isn’t it the job of journalists to sort through information and uncover the real story behind it?
As Silver says, “The problem is often in assuming that because you’ve cited a number, you’ve relieved yourself of the burden of interpreting the evidence.” In an interview several days after the election, I attributed the general failure to anticipate Trump’s win (I only gave him a 30 percent chance of winning the day before) to the fact that while most of the data indicated that the race with Clinton was close, it was mainly close in one direction — showing a Clinton win. In other words, it wasn’t as if a series of polls were split on who’d win — with three showing a Trump win, three showing a Hillary win, and the average edge going to Hillary — they were overwhelmingly showing a close Clinton win. In Michigan nine of the last ten polls showed Hillary winning. In Pennsylvania it was eight of the last ten. Pundits like me paid too much attention, in hindsight, to the number of polls indicating a Hillary victory than to the consistent closeness of the race. The closeness indicated far more unpredictability in the outcome than I expected.
At any rate, Silver is a smart man who took heat from the Left for believing that Trump had a greater chance to win than most other outlets were predicting. His work is honest and illuminating. Read the whole series. You won’t regret it.



Comments