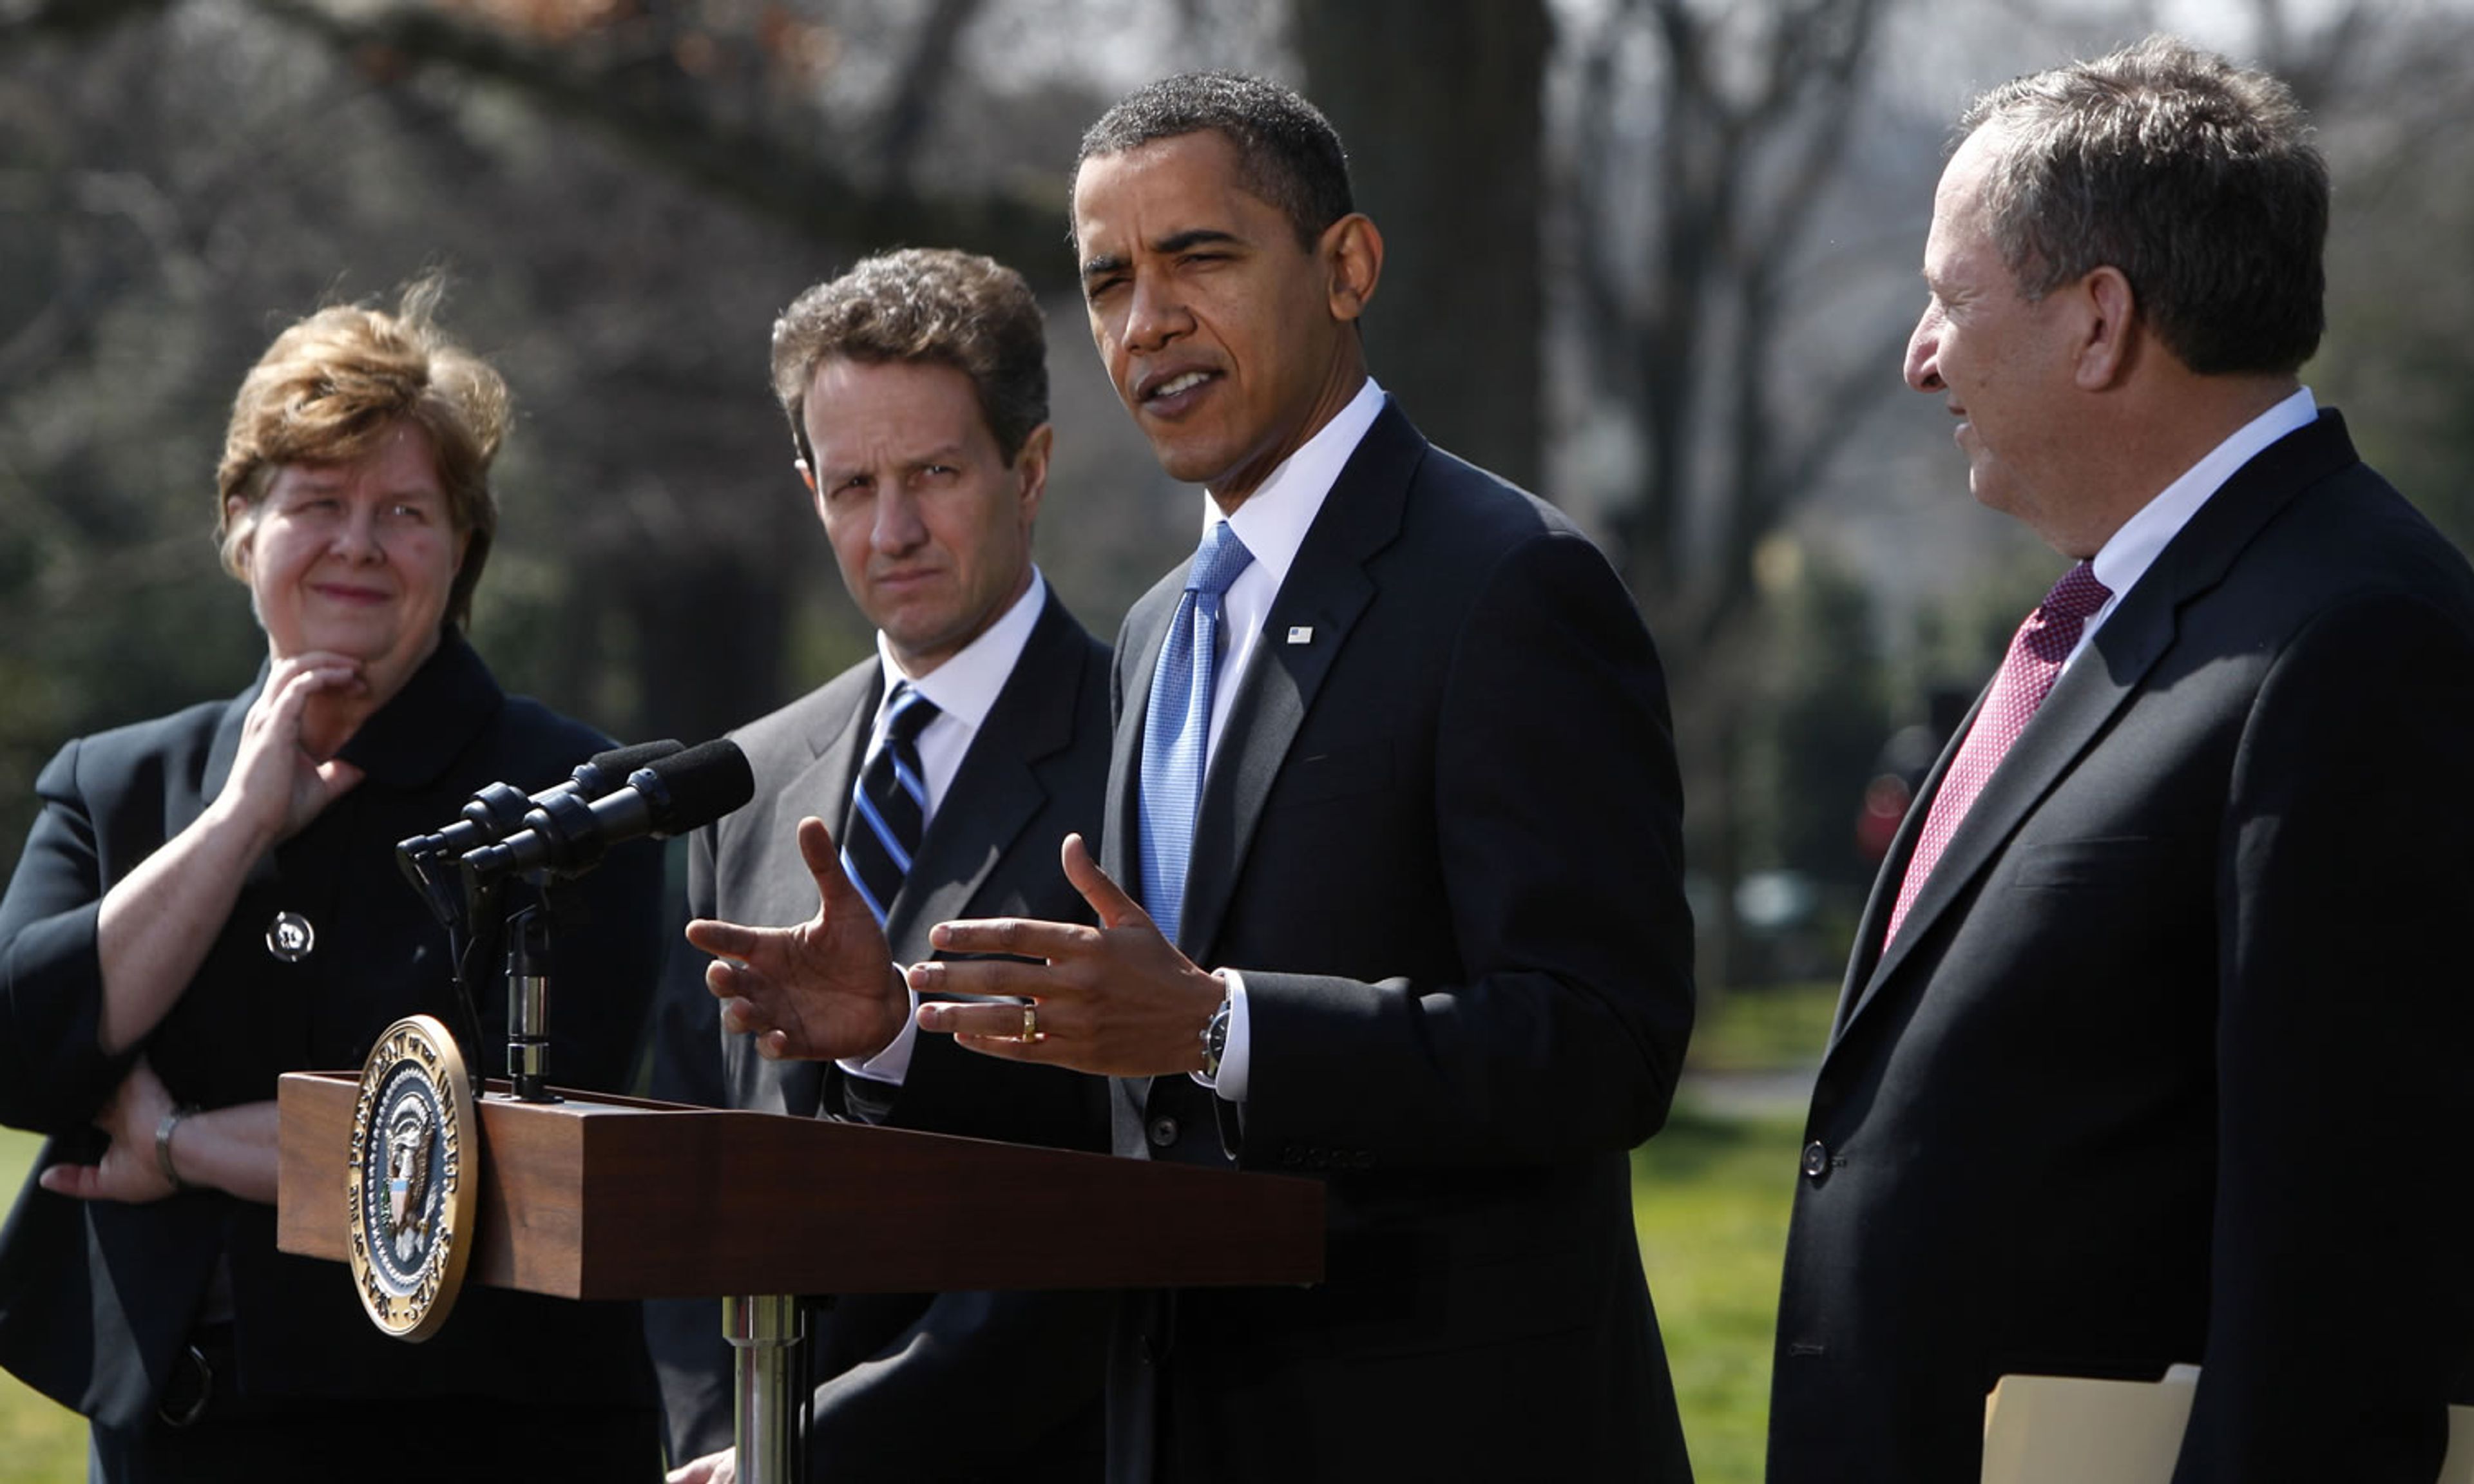
Just nine months into his presidency, Barack Obama’s call for Americans to cast aside their disillusionment and frustration with Washington politics rings increasingly hollow. Many have seen his administration use brass-knuckle Chicago politics, and embrace the cynicism that the candidate once criticized, to push a partisan agenda.
For economists, this cynicism may have been most evident in the way the White House strong-armed the so-called stimulus package through Congress, using dubious economic forecasting by staff economists. The candidate who promised public policy based on evidence and fiscal responsibility has built a deceptive statistical façade to support his agenda.
That the nation was in a recession when Obama took office was beyond doubt. The National Bureau of Economic Research (NBER) Business Cycle Dating Committee, the widely recognized professional arbiter of when business cycles peak and trough, pronounced the recession one year old on Dec. 1, 2008. The controversy was over what, if anything, the federal government should or could do to right the ship.
As the recession took hold in 2008, most economists were scrambling to understand its causes. Caught flat-footed, they recognized that their policy recommendations were based as much on gut, personal experience, and political philosophy as on the empirical models that had proven incapable of forecasting the worst recession in 25 years.
Macroeconomic forecasting is at least as much art as science. Most professional economists recognize the hazards of predicting an economic peak or trough. Recent NBER pronouncements indicate that this task is getting even more difficult. It took the Business Cycle Dating Committee nine months finally to declare the economy in recession during the 1990–91 downturn, and 21 months to proclaim it officially over. The committee took eight months to declare the economy in recession in 2001, but over a year to declare it over. The committee reviewed data for a year before declaring the start of this recession.
This is why the White House’s use of forecasting to aggressively promote its political agenda is so troubling.
Beginning with a report written by Christina Romer, the current chairwoman of the President’s Council of Economic Advisers, and Jared Bernstein, now Vice President Biden’s chief economist, the White House trotted out numbers based on statistically naïve and simplistic methods in order to drum up support for the stimulus package.
Romer and Bernstein’s initial report, released prior to the president’s inauguration in January 2009, estimated that a hypothetical $775 billion stimulus plan that included government spending and tax cuts would generate jobs in a “reasonable range” of 3.3 to 4.1 million by the end of 2010. Perhaps in an effort to preserve some academic credibility, Romer and Bernstein were somewhat circumspect in their analysis: “Our estimates of economic relationships and rules of thumb are derived from historical experience and so will not apply exactly to any given episode. Furthermore, the uncertainty is surely higher than normal now because the current recession is unusual both in its fundamental causes and severity.”
If the story stopped here, few people would cry foul. Romer and Bernstein’s analysis was simply one more report issued as policymakers and academics scrambled to figure out what to do about the economy. Analysis from all quarters is useful in determining macro policy, particularly during periods of extraordinary uncertainty.
But it didn’t stop there, and that’s where questions of professional ethics arise. A well-known principle of statistics is that the accuracy of estimates falls the more specific, narrow, or infrequent the data become. Predicting economy-wide trends is easier than predicting what will happen to individual households. Even predicting statewide economic performance is tricky. Predicting local trends from macroeconomic analysis is almost impossible. These processes are fraught with all sorts of methodological land mines, not the least of which is the idiosyncratic nature of local economic growth.
Nevertheless, Romer and Bernstein’s model of the national economy was tweaked by the newly installed administration to create state-by-state estimates of the number of jobs that would be “saved” or “created” by the stimulus bill.
Leaving aside problems such as the practical impossibility of distinguishing between a job “saved” and a job “created,” or the wisdom of failing to adjust for state-specific conditions, the White House divvied up the 3.5 million jobs it claimed the stimulus bill would save or create among the 50 states over the next two years in a report issued in February 2009. Largely rural Alabama would reap economic benefits that included 52,000 jobs saved or created. Natural-resource-dependent Wyoming would get 8,000 jobs. The hard-hit industrial Midwest would see 109,000 stimulus-driven jobs in Michigan, 133,000 jobs in Ohio, 75,000 jobs in Indiana, and 148,000 jobs in Obama’s home state of Illinois. California would be the biggest winner, as stimulus spending would create or save nearly 400,000 jobs there. Texas, which had yet to slip into a true recession at the time the report was published, was expected to benefit from 269,000 jobs either saved or created.
In a truly audacious stretch of statistical credibility, Romer and Bernstein’s national macroeconomic model was used to predict jobs saved or created for every congressional district in the nation. Indiana’s seventh district, home to Indianapolis, would get 7,700 jobs as a result of the stimulus package. The three congressional districts encompassing already growing Columbus, Ohio, were forecasted to get about 8,000 jobs each.
In a typically implausible result, Ohio’s poor and rural sixth district, a twelve-county region snaking along the hilly eastern reaches of the Ohio River, was forecast to get 7,200 jobs from the stimulus. The same area added just 3,500 real jobs between 2000 and 2007, which means the stimulus package would match to nearly double in two years what national macroeconomic expansion accomplished in six years.
California’s 25th district, a vast area stretching westward from the Nevada border, would get 8,400 jobs. The ritzy 23rd district along the Pacific Coast Highway would get 7,100 jobs, while the 24th, including the inland portions of wealthy Santa Barbara and Ventura counties, would get 7,300 jobs.
If these estimates seem fishy because they fall into a very narrow range (between 6,500 and 9,200 for all districts in California), they should. Essentially, the job growth is distributed based on population with little or no analysis of or adjustment for local conditions, historical trends, and other economic strengths and weaknesses. Not surprisingly, no congressional district in the nation would be worse off than before the stimulus.
It’s almost as if White House economists were betting no one would examine their results closely. And they were right. Only a few conservative and libertarian bloggers (including the Reason Foundation) noticed the statistical sleight of hand.
But the day of reckoning is here. While the White House’s stimulus job estimates were expected to track job growth through the end of 2010, the first eight months of the Obama administration are really all we need to know. The real world has shown what most economists already knew: The statistical predictions were meaningless. The computer models on which they were based, like those that did not predict the recession in the first place, have failed.
Romer and Bernstein claimed with strikingly confident precision that unemployment would peak in the third quarter at about 8 percent. Then, unemployment would fall through the remainder of the year and into 2010, settling back to the historical unemployment rate of about 5 percent sometime in 2013.
The real world is showing the folly behind these predictions. The unemployment rate stood at 9.8 percent in September 2009, and most mainstream economists expect it to climb higher. Employment fell by 392,000 jobs in August and 785,000 in September. The number of unemployed — those without a job but looking for work — increased by 466,000 in August and 214,000 in September. Over the summer, the number of unemployed climbed from 14.7 million to 15.1 million.
Indeed, 14 states and the District of Columbia had unemployment rates over 10 percent by August 2009, according to the U.S. Bureau of Labor Statistics. Michigan, Nevada, Rhode Island, California, and Oregon led the nation in unemployment with rates of 15.2 percent, 13.2 percent, 12.8 percent, 12.2 percent, and 12.2 percent. Moreover, the Congressional Budget Office warned in testimony to the House Budget Committee in May 2009 that the national unemployment rate would peak at over 10 percent.
At best, the White House can be accused of adopting a naïve approach to economic analysis and statistics. At worst, its economic forecasting was a cynical misuse of applied economic analysis to manipulate people into supporting a short-term political goal. Given the high caliber of his economic team, the American public may legitimately ask whether the latter interpretation is more accurate. Either way, this misuse of data and analysis isn’t the kind of change the American people voted for when they bought into presidential Candidate Obama’s campaign message to “turn the page” on politics as usual.







Comments